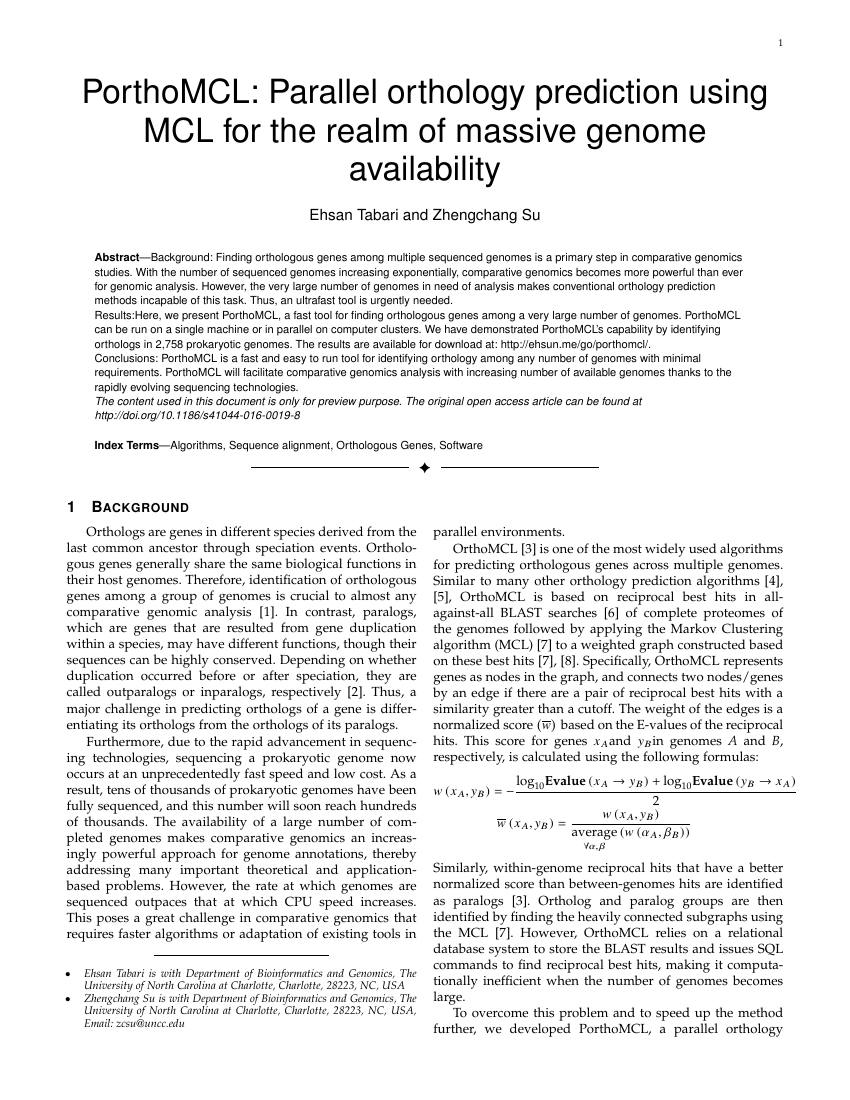
Example of IEEE Transactions on Visualization and Computer Graphics format
Recent searches

Example of IEEE Transactions on Visualization and Computer Graphics format Example of IEEE Transactions on Visualization and Computer Graphics format Example of IEEE Transactions on Visualization and Computer Graphics format Example of IEEE Transactions on Visualization and Computer Graphics format
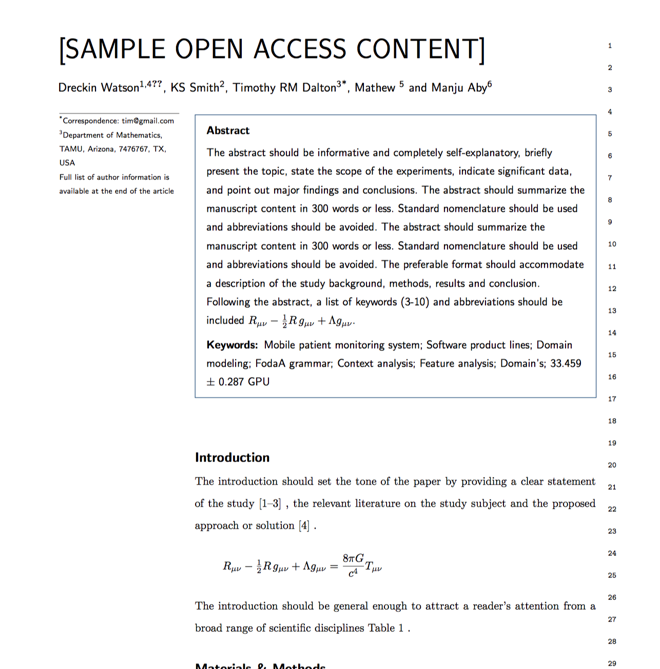
Sample paper formatted on SciSpace - SciSpace
This content is only for preview purposes. The original open access content can be found here.
Look Inside
Example of IEEE Transactions on Visualization and Computer Graphics format Example of IEEE Transactions on Visualization and Computer Graphics format Example of IEEE Transactions on Visualization and Computer Graphics format Example of IEEE Transactions on Visualization and Computer Graphics format
Sample paper formatted on SciSpace - SciSpace
This content is only for preview purposes. The original open access content can be found here.
open access Open Access
recommended Recommended

IEEE Transactions on Visualization and Computer Graphics — Template for authors

Publisher: IEEE
Categories Rank Trend in last 3 yrs
Computer Graphics and Computer-Aided Design #6 of 88 up up by 1 rank
Software #30 of 389 up up by 15 ranks
Computer Vision and Pattern Recognition #7 of 85 up up by 2 ranks
Signal Processing #11 of 108 up up by 2 ranks
journal-quality-icon Journal quality:
High
calendar-icon Last 4 years overview: 1069 Published Papers | 12186 Citations
indexed-in-icon Indexed in: Scopus
last-updated-icon Last updated: 06/07/2020
Related journals
Insights
General info
Top papers
Popular templates
Get started guide
Why choose from SciSpace
FAQ

Related Journals

open access Open Access
recommended Recommended

Elsevier

Quality:  
High
CiteRatio: 15.7
SJR: 1.492
SNIP: 3.419
open access Open Access

Elsevier

Quality:  
High
CiteRatio: 6.3
SJR: 0.544
SNIP: 1.494
open access Open Access

Elsevier

Quality:  
High
CiteRatio: 6.7
SJR: 0.669
SNIP: 1.739
open access Open Access
recommended Recommended

Elsevier

Quality:  
High
CiteRatio: 10.0
SJR: 0.854
SNIP: 2.059

Journal Performance & Insights

Impact Factor

CiteRatio

Determines the importance of a journal by taking a measure of frequency with which the average article in a journal has been cited in a particular year.

A measure of average citations received per peer-reviewed paper published in the journal.

4.558

21% from 2018

Impact factor for IEEE Transactions on Visualization and Computer Graphics from 2016 - 2019
Year Value
2019 4.558
2018 3.78
2017 3.078
2016 2.84
graph view Graph view
table view Table view

11.4

13% from 2019

CiteRatio for IEEE Transactions on Visualization and Computer Graphics from 2016 - 2020
Year Value
2020 11.4
2019 10.1
2018 7.1
2017 6.8
2016 6.8
graph view Graph view
table view Table view

insights Insights

  • Impact factor of this journal has increased by 21% in last year.
  • This journal’s impact factor is in the top 10 percentile category.

insights Insights

  • CiteRatio of this journal has increased by 13% in last years.
  • This journal’s CiteRatio is in the top 10 percentile category.

SCImago Journal Rank (SJR)

Source Normalized Impact per Paper (SNIP)

Measures weighted citations received by the journal. Citation weighting depends on the categories and prestige of the citing journal.

Measures actual citations received relative to citations expected for the journal's category.

1.005

34% from 2019

SJR for IEEE Transactions on Visualization and Computer Graphics from 2016 - 2020
Year Value
2020 1.005
2019 1.519
2018 0.957
2017 0.869
2016 1.169
graph view Graph view
table view Table view

2.547

1% from 2019

SNIP for IEEE Transactions on Visualization and Computer Graphics from 2016 - 2020
Year Value
2020 2.547
2019 2.573
2018 2.619
2017 2.283
2016 2.54
graph view Graph view
table view Table view

insights Insights

  • SJR of this journal has decreased by 34% in last years.
  • This journal’s SJR is in the top 10 percentile category.

insights Insights

  • SNIP of this journal has decreased by 1% in last years.
  • This journal’s SNIP is in the top 10 percentile category.
IEEE Transactions on Visualization and Computer Graphics

Guideline source: View

All company, product and service names used in this website are for identification purposes only. All product names, trademarks and registered trademarks are property of their respective owners.

Use of these names, trademarks and brands does not imply endorsement or affiliation. Disclaimer Notice

IEEE

IEEE Transactions on Visualization and Computer Graphics

Visualization techniques and methodologies; visualization systems and software; volume visualization; flow visualization; multivariate visualization; modeling and surfaces; rendering; animation; user interfaces; visual progranuning; applications.... Read More

Computer Graphics and Computer-Aided Design

Software

Computer Vision and Pattern Recognition

Signal Processing

Computer Science

i
Last updated on
05 Jul 2020
i
ISSN
1077-2626
i
Impact Factor
High - 2.629
i
Open Access
No
i
Sherpa RoMEO Archiving Policy
Green faq
i
Plagiarism Check
Available via Turnitin
i
Endnote Style
Download Available
i
Bibliography Name
IEEEtran
i
Citation Type
Numbered
[25]
i
Bibliography Example
C. W. J. Beenakker, “Specular andreev reflection in graphene,” Phys. Rev. Lett., vol. 97, no. 6, p.

Top papers written in this journal

Journal Article DOI: 10.1109/TVCG.2011.185
D³ Data-Driven Documents
Michael Bostock1, Vadim Ogievetsky1, Jeffrey Heer1

Abstract:

Data-Driven Documents (D3) is a novel representation-transparent approach to visualization for the web Rather than hide the underlying scenegraph within a toolkit-specific abstraction, D3 enables direct inspection and manipulation of a native representation: the standard document object model (DOM) With D3, designers selectiv... Data-Driven Documents (D3) is a novel representation-transparent approach to visualization for the web Rather than hide the underlying scenegraph within a toolkit-specific abstraction, D3 enables direct inspection and manipulation of a native representation: the standard document object model (DOM) With D3, designers selectively bind input data to arbitrary document elements, applying dynamic transforms to both generate and modify content We show how representational transparency improves expressiveness and better integrates with developer tools than prior approaches, while offering comparable notational efficiency and retaining powerful declarative components Immediate evaluation of operators further simplifies debugging and allows iterative development Additionally, we demonstrate how D3 transforms naturally enable animation and interaction with dramatic performance improvements over intermediate representations read more read less

Topics:

Visualization (51%)51% related to the paper
View PDF
2,550 Citations
Journal Article DOI: 10.1109/2945.981847
Information visualization and visual data mining
Daniel A. Keim1
AT&T1

Abstract:

Never before in history has data been generated at such high volumes as it is today. Exploring and analyzing the vast volumes of data is becoming increasingly difficult. Information visualization and visual data mining can help to deal with the flood of information. The advantage of visual data exploration is that the user is... Never before in history has data been generated at such high volumes as it is today. Exploring and analyzing the vast volumes of data is becoming increasingly difficult. Information visualization and visual data mining can help to deal with the flood of information. The advantage of visual data exploration is that the user is directly involved in the data mining process. There are a large number of information visualization techniques which have been developed over the last decade to support the exploration of large data sets. In this paper, we propose a classification of information visualization and visual data mining techniques which is based on the data type to be visualized, the visualization technique, and the interaction and distortion technique. We exemplify the classification using a few examples, most of them referring to techniques and systems presented in this special section. read more read less

Topics:

Information visualization (73%)73% related to the paper, Visual analytics (69%)69% related to the paper, Data visualization (69%)69% related to the paper, Interactive visual analysis (68%)68% related to the paper, Visualization (64%)64% related to the paper
View PDF
1,759 Citations
Journal Article DOI: 10.1109/2945.841119
Graph visualization and navigation in information visualization: A survey
Ivan Herman, Guy Melançon, M. S Marshall

Abstract:

This is a survey on graph visualization and navigation techniques, as used in information visualization. Graphs appear in numerous applications such as Web browsing, state-transition diagrams, and data structures. The ability to visualize and to navigate in these potentially large, abstract graphs is often a crucial part of a... This is a survey on graph visualization and navigation techniques, as used in information visualization. Graphs appear in numerous applications such as Web browsing, state-transition diagrams, and data structures. The ability to visualize and to navigate in these potentially large, abstract graphs is often a crucial part of an application. Information visualization has specific requirements, which means that this survey approaches the results of traditional graph drawing from a different perspective. read more read less

Topics:

Information visualization (71%)71% related to the paper, Visualization (66%)66% related to the paper, Visual analytics (66%)66% related to the paper, Graph drawing (66%)66% related to the paper, Data visualization (63%)63% related to the paper
View PDF
1,648 Citations
open accessOpen access Journal Article DOI: 10.1109/TVCG.2014.2346248
UpSet: Visualization of Intersecting Sets.
Alexander Lex1, Nils Gehlenborg1, Hendrik Strobelt1, Romain Vuillemot1, Hanspeter Pfister1

Abstract:

Understanding relationships between sets is an important analysis task that has received widespread attention in the visualization community. The major challenge in this context is the combinatorial explosion of the number of set intersections if the number of sets exceeds a trivial threshold. In this paper we introduce UpSet... Understanding relationships between sets is an important analysis task that has received widespread attention in the visualization community. The major challenge in this context is the combinatorial explosion of the number of set intersections if the number of sets exceeds a trivial threshold. In this paper we introduce UpSet, a novel visualization technique for the quantitative analysis of sets, their intersections, and aggregates of intersections. UpSet is focused on creating task-driven aggregates, communicating the size and properties of aggregates and intersections, and a duality between the visualization of the elements in a dataset and their set membership. UpSet visualizes set intersections in a matrix layout and introduces aggregates based on groupings and queries. The matrix layout enables the effective representation of associated data, such as the number of elements in the aggregates and intersections, as well as additional summary statistics derived from subset or element attributes. Sorting according to various measures enables a task-driven analysis of relevant intersections and aggregates. The elements represented in the sets and their associated attributes are visualized in a separate view. Queries based on containment in specific intersections, aggregates or driven by attribute filters are propagated between both views. We also introduce several advanced visual encodings and interaction methods to overcome the problems of varying scales and to address scalability. UpSet is web-based and open source. We demonstrate its general utility in multiple use cases from various domains. read more read less

Topics:

Visualization (52%)52% related to the paper, Data visualization (52%)52% related to the paper
View PDF
1,332 Citations
Journal Article DOI: 10.1109/2945.817351
The ball-pivoting algorithm for surface reconstruction
Fausto Bernardini1, Joshua Mittleman1, Holly Rushmeier1, Cláudio T. Silva, Gabriel Taubin1
IBM1

Abstract:

The Ball-Pivoting Algorithm (BPA) computes a triangle mesh interpolating a given point cloud. Typically, the points are surface samples acquired with multiple range scans of an object. The principle of the BPA is very simple: Three points form a triangle if a ball of a user-specified radius p touches them without containing a... The Ball-Pivoting Algorithm (BPA) computes a triangle mesh interpolating a given point cloud. Typically, the points are surface samples acquired with multiple range scans of an object. The principle of the BPA is very simple: Three points form a triangle if a ball of a user-specified radius p touches them without containing any other point. Starting with a seed triangle, the ball pivots around an edge (i.e., it revolves around the edge while keeping in contact with the edge's endpoints) until it touches another point, forming another triangle. The process continues until all reachable edges have been tried, and then starts from another seed triangle, until all points have been considered. The process can then be repeated with a ball of larger radius to handle uneven sampling densities. We applied the BPA to datasets of millions of points representing actual scans of complex 3D objects. The relatively small amount of memory required by the BPA, its time efficiency, and the quality of the results obtained compare favorably with existing techniques. read more read less

Topics:

Triangle mesh (59%)59% related to the paper, Point cloud (53%)53% related to the paper
View PDF
1,311 Citations
Author Pic

SciSpace is a very innovative solution to the formatting problem and existing providers, such as Mendeley or Word did not really evolve in recent years.

- Andreas Frutiger, Researcher, ETH Zurich, Institute for Biomedical Engineering

Get MS-Word and LaTeX output to any Journal within seconds
1
Choose a template
Select a template from a library of 40,000+ templates
2
Import a MS-Word file or start fresh
It takes only few seconds to import
3
View and edit your final output
SciSpace will automatically format your output to meet journal guidelines
4
Submit directly or Download
Submit to journal directly or Download in PDF, MS Word or LaTeX

(Before submission check for plagiarism via Turnitin)

clock Less than 3 minutes

What to expect from SciSpace?

Speed and accuracy over MS Word

''

With SciSpace, you do not need a word template for IEEE Transactions on Visualization and Computer Graphics.

It automatically formats your research paper to IEEE formatting guidelines and citation style.

You can download a submission ready research paper in pdf, LaTeX and docx formats.

Time comparison

Time taken to format a paper and Compliance with guidelines

Plagiarism Reports via Turnitin

SciSpace has partnered with Turnitin, the leading provider of Plagiarism Check software.

Using this service, researchers can compare submissions against more than 170 million scholarly articles, a database of 70+ billion current and archived web pages. How Turnitin Integration works?

Turnitin Stats
Publisher Logos

Freedom from formatting guidelines

One editor, 100K journal formats – world's largest collection of journal templates

With such a huge verified library, what you need is already there.
publisher-logos

Easy support from all your favorite tools

IEEE Transactions on Visualization and Computer Graphics format uses IEEEtran citation style.

Automatically format and order your citations and bibliography in a click.

SciSpace allows imports from all reference managers like Mendeley, Zotero, Endnote, Google Scholar etc.

Frequently asked questions

1. Can I write IEEE Transactions on Visualization and Computer Graphics in LaTeX?

Absolutely not! Our tool has been designed to help you focus on writing. You can write your entire paper as per the IEEE Transactions on Visualization and Computer Graphics guidelines and auto format it.

2. Do you follow the IEEE Transactions on Visualization and Computer Graphics guidelines?

Yes, the template is compliant with the IEEE Transactions on Visualization and Computer Graphics guidelines. Our experts at SciSpace ensure that. If there are any changes to the journal's guidelines, we'll change our algorithm accordingly.

3. Can I cite my article in multiple styles in IEEE Transactions on Visualization and Computer Graphics?

Of course! We support all the top citation styles, such as APA style, MLA style, Vancouver style, Harvard style, and Chicago style. For example, when you write your paper and hit autoformat, our system will automatically update your article as per the IEEE Transactions on Visualization and Computer Graphics citation style.

4. Can I use the IEEE Transactions on Visualization and Computer Graphics templates for free?

Sign up for our free trial, and you'll be able to use all our features for seven days. You'll see how helpful they are and how inexpensive they are compared to other options, Especially for IEEE Transactions on Visualization and Computer Graphics.

5. Can I use a manuscript in IEEE Transactions on Visualization and Computer Graphics that I have written in MS Word?

Yes. You can choose the right template, copy-paste the contents from the word document, and click on auto-format. Once you're done, you'll have a publish-ready paper IEEE Transactions on Visualization and Computer Graphics that you can download at the end.

6. How long does it usually take you to format my papers in IEEE Transactions on Visualization and Computer Graphics?

It only takes a matter of seconds to edit your manuscript. Besides that, our intuitive editor saves you from writing and formatting it in IEEE Transactions on Visualization and Computer Graphics.

7. Where can I find the template for the IEEE Transactions on Visualization and Computer Graphics?

It is possible to find the Word template for any journal on Google. However, why use a template when you can write your entire manuscript on SciSpace , auto format it as per IEEE Transactions on Visualization and Computer Graphics's guidelines and download the same in Word, PDF and LaTeX formats? Give us a try!.

8. Can I reformat my paper to fit the IEEE Transactions on Visualization and Computer Graphics's guidelines?

Of course! You can do this using our intuitive editor. It's very easy. If you need help, our support team is always ready to assist you.

9. IEEE Transactions on Visualization and Computer Graphics an online tool or is there a desktop version?

SciSpace's IEEE Transactions on Visualization and Computer Graphics is currently available as an online tool. We're developing a desktop version, too. You can request (or upvote) any features that you think would be helpful for you and other researchers in the "feature request" section of your account once you've signed up with us.

10. I cannot find my template in your gallery. Can you create it for me like IEEE Transactions on Visualization and Computer Graphics?

Sure. You can request any template and we'll have it setup within a few days. You can find the request box in Journal Gallery on the right side bar under the heading, "Couldn't find the format you were looking for like IEEE Transactions on Visualization and Computer Graphics?”

11. What is the output that I would get after using IEEE Transactions on Visualization and Computer Graphics?

After writing your paper autoformatting in IEEE Transactions on Visualization and Computer Graphics, you can download it in multiple formats, viz., PDF, Docx, and LaTeX.

12. Is IEEE Transactions on Visualization and Computer Graphics's impact factor high enough that I should try publishing my article there?

To be honest, the answer is no. The impact factor is one of the many elements that determine the quality of a journal. Few of these factors include review board, rejection rates, frequency of inclusion in indexes, and Eigenfactor. You need to assess all these factors before you make your final call.

13. What is Sherpa RoMEO Archiving Policy for IEEE Transactions on Visualization and Computer Graphics?

SHERPA/RoMEO Database

We extracted this data from Sherpa Romeo to help researchers understand the access level of this journal in accordance with the Sherpa Romeo Archiving Policy for IEEE Transactions on Visualization and Computer Graphics. The table below indicates the level of access a journal has as per Sherpa Romeo's archiving policy.

RoMEO Colour Archiving policy
Green Can archive pre-print and post-print or publisher's version/PDF
Blue Can archive post-print (ie final draft post-refereeing) or publisher's version/PDF
Yellow Can archive pre-print (ie pre-refereeing)
White Archiving not formally supported
FYI:
  1. Pre-prints as being the version of the paper before peer review and
  2. Post-prints as being the version of the paper after peer-review, with revisions having been made.

14. What are the most common citation types In IEEE Transactions on Visualization and Computer Graphics?

The 5 most common citation types in order of usage for IEEE Transactions on Visualization and Computer Graphics are:.

S. No. Citation Style Type
1. Author Year
2. Numbered
3. Numbered (Superscripted)
4. Author Year (Cited Pages)
5. Footnote

15. How do I submit my article to the IEEE Transactions on Visualization and Computer Graphics?

It is possible to find the Word template for any journal on Google. However, why use a template when you can write your entire manuscript on SciSpace , auto format it as per IEEE Transactions on Visualization and Computer Graphics's guidelines and download the same in Word, PDF and LaTeX formats? Give us a try!.

16. Can I download IEEE Transactions on Visualization and Computer Graphics in Endnote format?

Yes, SciSpace provides this functionality. After signing up, you would need to import your existing references from Word or Bib file to SciSpace. Then SciSpace would allow you to download your references in IEEE Transactions on Visualization and Computer Graphics Endnote style according to Elsevier guidelines.

Fast and reliable,
built for complaince.

Instant formatting to 100% publisher guidelines on - SciSpace.
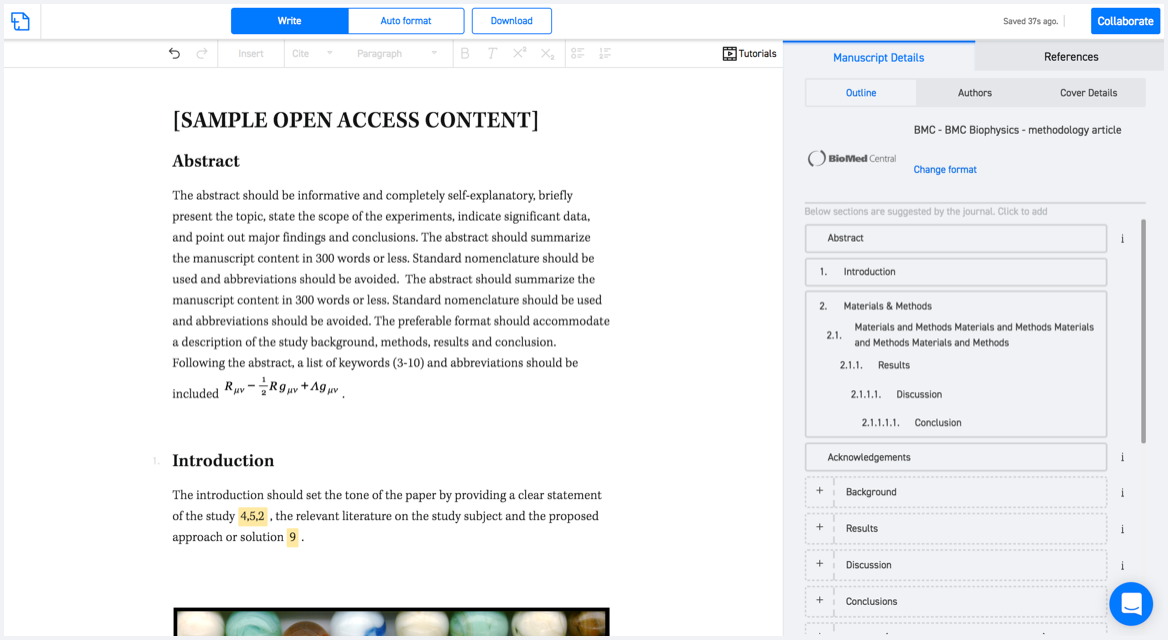
Available only on desktops 🖥

No word template required

Typset automatically formats your research paper to IEEE Transactions on Visualization and Computer Graphics formatting guidelines and citation style.

Verifed journal formats

One editor, 100K journal formats.
With the largest collection of verified journal formats, what you need is already there.

Trusted by academicians

I spent hours with MS word for reformatting. It was frustrating - plain and simple. With SciSpace, I can draft my manuscripts and once it is finished I can just submit. In case, I have to submit to another journal it is really just a button click instead of an afternoon of reformatting.

Andreas Frutiger
Researcher & Ex MS Word user
Use this template