Example of Climate Dynamics format
Recent searches

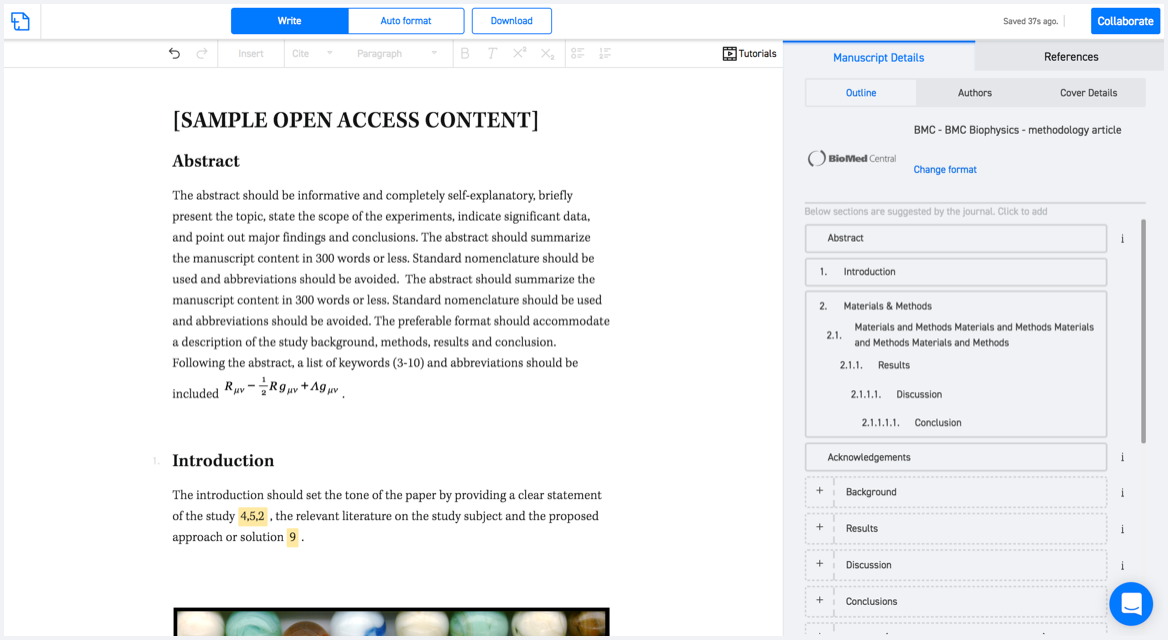
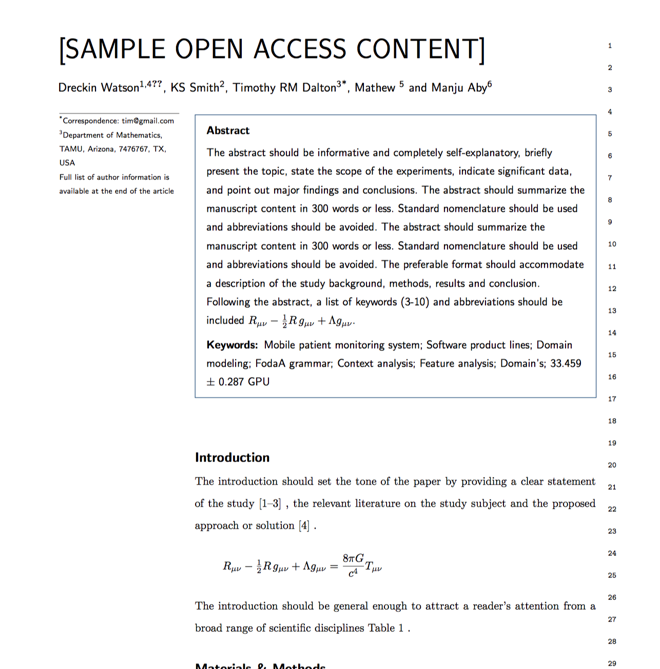
Example of Climate Dynamics format Example of Climate Dynamics format Example of Climate Dynamics format Example of Climate Dynamics format Example of Climate Dynamics format Example of Climate Dynamics format Example of Climate Dynamics format Example of Climate Dynamics format Example of Climate Dynamics format Example of Climate Dynamics format Example of Climate Dynamics format Example of Climate Dynamics format Example of Climate Dynamics format Example of Climate Dynamics format Example of Climate Dynamics format Example of Climate Dynamics format Example of Climate Dynamics format Example of Climate Dynamics format
Sample paper formatted on SciSpace - SciSpace
This content is only for preview purposes. The original open access content can be found here.
Look Inside
Example of Climate Dynamics format Example of Climate Dynamics format Example of Climate Dynamics format Example of Climate Dynamics format Example of Climate Dynamics format Example of Climate Dynamics format Example of Climate Dynamics format Example of Climate Dynamics format Example of Climate Dynamics format Example of Climate Dynamics format Example of Climate Dynamics format Example of Climate Dynamics format Example of Climate Dynamics format Example of Climate Dynamics format Example of Climate Dynamics format Example of Climate Dynamics format Example of Climate Dynamics format Example of Climate Dynamics format
Sample paper formatted on SciSpace - SciSpace
This content is only for preview purposes. The original open access content can be found here.
open access Open Access

Climate Dynamics — Template for authors

Publisher: Springer
Categories Rank Trend in last 3 yrs
Atmospheric Science #16 of 124 down down by 10 ranks
journal-quality-icon Journal quality:
High
calendar-icon Last 4 years overview: 2301 Published Papers | 17379 Citations
indexed-in-icon Indexed in: Scopus
last-updated-icon Last updated: 15/07/2020
Related journals
Insights
General info
Top papers
Popular templates
Get started guide
Why choose from SciSpace
FAQ

Related Journals

open access Open Access

IEEE

Quality:  
High
CiteRatio: 7.2
SJR: 1.246
SNIP: 1.579
open access Open Access
recommended Recommended

American Meteorological Society

Quality:  
High
CiteRatio: 13.5
SJR: 3.367
SNIP: 2.93
open access Open Access

American Meteorological Society

Quality:  
High
CiteRatio: 4.1
SJR: 0.774
SNIP: 1.154
open access Open Access
recommended Recommended

American Meteorological Society

Quality:  
High
CiteRatio: 9.8
SJR: 3.315
SNIP: 1.909

Journal Performance & Insights

Impact Factor

CiteRatio

Determines the importance of a journal by taking a measure of frequency with which the average article in a journal has been cited in a particular year.

A measure of average citations received per peer-reviewed paper published in the journal.

4.486

11% from 2018

Impact factor for Climate Dynamics from 2016 - 2019
Year Value
2019 4.486
2018 4.048
2017 3.774
2016 4.146
graph view Graph view
table view Table view

7.6

13% from 2019

CiteRatio for Climate Dynamics from 2016 - 2020
Year Value
2020 7.6
2019 6.7
2018 6.8
2017 7.3
2016 8.3
graph view Graph view
table view Table view

insights Insights

  • Impact factor of this journal has increased by 11% in last year.
  • This journal’s impact factor is in the top 10 percentile category.

insights Insights

  • CiteRatio of this journal has increased by 13% in last years.
  • This journal’s CiteRatio is in the top 10 percentile category.

SCImago Journal Rank (SJR)

Source Normalized Impact per Paper (SNIP)

Measures weighted citations received by the journal. Citation weighting depends on the categories and prestige of the citing journal.

Measures actual citations received relative to citations expected for the journal's category.

2.026

13% from 2019

SJR for Climate Dynamics from 2016 - 2020
Year Value
2020 2.026
2019 2.32
2018 2.59
2017 2.445
2016 3.248
graph view Graph view
table view Table view

1.352

12% from 2019

SNIP for Climate Dynamics from 2016 - 2020
Year Value
2020 1.352
2019 1.533
2018 1.472
2017 1.354
2016 1.472
graph view Graph view
table view Table view

insights Insights

  • SJR of this journal has decreased by 13% in last years.
  • This journal’s SJR is in the top 10 percentile category.

insights Insights

  • SNIP of this journal has decreased by 12% in last years.
  • This journal’s SNIP is in the top 10 percentile category.
Climate Dynamics

Guideline source: View

All company, product and service names used in this website are for identification purposes only. All product names, trademarks and registered trademarks are property of their respective owners.

Use of these names, trademarks and brands does not imply endorsement or affiliation. Disclaimer Notice

Springer

Climate Dynamics

To provide an international journal for the publication of high-quality research on all aspects of the dynamics of the global climate system.... Read More

Atmospheric Science

Earth and Planetary Sciences

i
Last updated on
15 Jul 2020
i
ISSN
0930-7575
i
Impact Factor
Very High - 4.146
i
Acceptance Rate
Not provided
i
Frequency
Not provided
i
Open Access
Yes
i
Sherpa RoMEO Archiving Policy
Green faq
i
Plagiarism Check
Available via Turnitin
i
Endnote Style
Download Available
i
Bibliography Name
SPBASIC
i
Citation Type
Author Year
(Blonder et al, 1982)
i
Bibliography Example
Beenakker CWJ (2006) Specular andreev reflection in graphene. Phys Rev Lett 97(6):067,007, URL 10.1103/PhysRevLett.97.067007

Top papers written in this journal

Journal Article DOI: 10.1007/S003820050010
The simulation of SST, sea ice extents and ocean heat transports in a version of the Hadley Centre coupled model without flux adjustments
04 Feb 2000 - Climate Dynamics

Abstract:

Results are presented from a new version of the Hadley Centre coupled model (HadCM3) that does not require flux adjustments to prevent large climate drifts in the simulation The model has both an improved atmosphere and ocean component In particular, the ocean has a 125° × 125° degree horizontal resolution and leads to a cons... Results are presented from a new version of the Hadley Centre coupled model (HadCM3) that does not require flux adjustments to prevent large climate drifts in the simulation The model has both an improved atmosphere and ocean component In particular, the ocean has a 125° × 125° degree horizontal resolution and leads to a considerably improved simulation of ocean heat transports compared to earlier versions with a coarser resolution ocean component The model does not have any spin up procedure prior to coupling and the simulation has been run for over 400 years starting from observed initial conditions The sea surface temperature (SST) and sea ice simulation are shown to be stable and realistic The trend in global mean SST is less than 0009 °C per century In part, the improved simulation is a consequence of a greater compatibility of the atmosphere and ocean model heat budgets The atmospheric model surface heat and momentum budget are evaluated by comparing with climatological ship-based estimates Similarly the ocean model simulation of poleward heat transports is compared with direct ship-based observations for a number of sections across the globe Despite the limitations of the observed datasets, it is shown that the coupled model is able to reproduce many aspects of the observed heat budget read more read less

Topics:

Ocean heat content (65%)65% related to the paper, Sea surface temperature (59%)59% related to the paper, HadGEM1 (56%)56% related to the paper, Sea ice (55%)55% related to the paper, Atmospheric model (54%)54% related to the paper
2,674 Citations
Journal Article DOI: 10.1007/BF00204745
Decadal atmosphere-ocean variations in the Pacific
Kevin E. Trenberth1, James W. Hurrell1
01 Mar 1994 - Climate Dynamics

Abstract:

Considerable evidence has emerged of a sub- stantial decade-long change in the north Pacific atmo- sphere and ocean lasting from about 1976 to 1988. Ob- served significant changes in the atmospheric circula- tion throughout the troposphere revealed a deeper and eastward shifted Aleutian low pressure system in the winter half ... Considerable evidence has emerged of a sub- stantial decade-long change in the north Pacific atmo- sphere and ocean lasting from about 1976 to 1988. Ob- served significant changes in the atmospheric circula- tion throughout the troposphere revealed a deeper and eastward shifted Aleutian low pressure system in the winter half year which advected warmer and moister air along the west coast of North America and into Alaska and colder air over the north Pacific. Conse- quently, there were increases in temperatures and sea surface temperatures (SSTs) along the west coast of North America and Alaska but decreases in SSTs over the central north Pacific, as well as changes in coastal rainfall and streamflow, and decreases in sea ice in the Bering Sea. Associated changes occurred in the surface wind stress, and, by inference, in the Sverdrup trans- port in the north Pacific Ocean. Changes in the month- ly mean flow were accompanied by a southward shift in the storm tracks and associated synoptic eddy activi- ty and in the surface ocean sensible and latent heat fluxes. In addition to the changes in the physical envi- ronment, the deeper Aleutian low increased the nu- trient supply as seen through increases in total chloro- phyll in the water column, phytoplankton and zoo- plankton. These changes, along with the altered ocean currents and temperatures, changed the migration pat- terns and increased the stock of many fish species. A north Pacific (NP) index is defined to measure the de- cadal variations, and the temporal variability of the in- dex is explored on daily, annual, interannual and de- cadal time scales. The dominant atmosphere-ocean re- lation in the north Pacific is one where atmospheric changes lead SSTs by one to two months. However, strong ties are revealed with events in the tropical Pa- cific, with changes in tropical Pacific SSTs leading SSTs in the north Pacific by three months. Changes in the storm tracks in the north Pacific help to reinforce and maintain the anomalous circulation in the upper tro- read more read less

Topics:

North Pacific Oscillation (66%)66% related to the paper, Pacific decadal oscillation (66%)66% related to the paper, North Pacific High (63%)63% related to the paper, Pacific–North American teleconnection pattern (58%)58% related to the paper, Ocean current (52%)52% related to the paper
View PDF
2,282 Citations
Journal Article DOI: 10.1007/S003820050009
The impact of new physical parametrizations in the Hadley Centre Climate Model—HADAM3
V. D. Pope1, M. L. Gallani1, P. R. Rowntree1, Rachel Stratton1
01 Jan 2000 - Climate Dynamics

Abstract:

Results are presented from the latest version of the Hadley Centre climate model, HadAM3 (Hadley Centre Atmospheric Model version 3). It represents a significant improvement over the previous version, HadAM2b. This is demonstrated using a series of ten year integrations with AMIP (Atmospheric Model Intercomparison Project) bo... Results are presented from the latest version of the Hadley Centre climate model, HadAM3 (Hadley Centre Atmospheric Model version 3). It represents a significant improvement over the previous version, HadAM2b. This is demonstrated using a series of ten year integrations with AMIP (Atmospheric Model Intercomparison Project) boundary conditions. The work covers three aspects of model performance: (1) it shows the improvements in the mean climate in changing from HadAM2b to HadAM3; (2) it demonstrates that the model now compares well with observations and (3) it isolates the impacts of new physical parametrizations. read more read less

Topics:

Atmospheric Model Intercomparison Project (61%)61% related to the paper, HadCM3 (59%)59% related to the paper, Climate model (53%)53% related to the paper, Atmospheric model (51%)51% related to the paper
1,596 Citations
open accessOpen access Journal Article DOI: 10.1007/S00382-012-1636-1
Climate change projections using the IPSL-CM5 Earth System Model: From CMIP3 to CMIP5
24 Feb 2013 - Climate Dynamics

Abstract:

We present the global general circulation model IPSL-CM5 developed to study the long-term response of the climate system to natural and anthropogenic forcings as part of the 5th Phase of the Coupled Model Intercomparison Project (CMIP5). This model includes an interactive carbon cycle, a representation of tropospheric and str... We present the global general circulation model IPSL-CM5 developed to study the long-term response of the climate system to natural and anthropogenic forcings as part of the 5th Phase of the Coupled Model Intercomparison Project (CMIP5). This model includes an interactive carbon cycle, a representation of tropospheric and stratospheric chemistry, and a comprehensive representation of aerosols. As it represents the principal dynamical, physical, and bio-geochemical processes relevant to the climate system, it may be referred to as an Earth System Model. However, the IPSL-CM5 model may be used in a multitude of configurations associated with different boundary conditions and with a range of complexities in terms of processes and interactions. This paper presents an overview of the different model components and explains how they were coupled and used to simulate historical climate changes over the past 150 years and different scenarios of future climate change. A single version of the IPSL-CM5 model (IPSL-CM5A-LR) was used to provide climate projections associated with different socio-economic scenarios, including the different Representative Concentration Pathways considered by CMIP5 and several scenarios from the Special Report on Emission Scenarios considered by CMIP3. Results suggest that the magnitude of global warming projections primarily depends on the socio-economic scenario considered, that there is potential for an aggressive mitigation policy to limit global warming to about two degrees, and that the behavior of some components of the climate system such as the Arctic sea ice and the Atlantic Meridional Overturning Circulation may change drastically by the end of the twenty-first century in the case of a no climate policy scenario. Although the magnitude of regional temperature and precipitation changes depends fairly linearly on the magnitude of the projected global warming (and thus on the scenario considered), the geographical pattern of these changes is strikingly similar for the different scenarios. The representation of atmospheric physical processes in the model is shown to strongly influence the simulated climate variability and both the magnitude and pattern of the projected climate changes. read more read less

Topics:

Climate model (68%)68% related to the paper, Global warming (67%)67% related to the paper, Climate commitment (63%)63% related to the paper, Downscaling (62%)62% related to the paper, Climate change (61%)61% related to the paper
View PDF
1,526 Citations
Journal Article DOI: 10.1007/S00382-008-0441-3
The global climatology of an interannually varying air–sea flux data set
William G. Large1, Stephen Yeager1
01 Aug 2009 - Climate Dynamics

Abstract:

The air–sea fluxes of momentum, heat, freshwater and their components have been computed globally from 1948 at frequencies ranging from 6-hourly to monthly. All fluxes are computed over the 23 years from 1984 to 2006, but radiation prior to 1984 and precipitation before 1979 are given only as climatological mean annual cycles... The air–sea fluxes of momentum, heat, freshwater and their components have been computed globally from 1948 at frequencies ranging from 6-hourly to monthly. All fluxes are computed over the 23 years from 1984 to 2006, but radiation prior to 1984 and precipitation before 1979 are given only as climatological mean annual cycles. The input data are based on NCEP reanalysis only for the near surface vector wind, temperature, specific humidity and density, and on a variety of satellite based radiation, sea surface temperature, sea-ice concentration and precipitation products. Some of these data are adjusted to agree in the mean with a variety of more reliable satellite and in situ measurements, that themselves are either too short a duration, or too regional in coverage. The major adjustments are a general increase in wind speed, decrease in humidity and reduction in tropical solar radiation. The climatological global mean air–sea heat and freshwater fluxes (1984–2006) then become 2 W/m2 and −0.1 mg/m2 per second, respectively, down from 30 W/m2 and 3.4 mg/m2 per second for the unaltered data. However, decadal means vary from 7.3 W/m2 (1977–1986) to −0.3 W/m2 (1997–2006). The spatial distributions of climatological fluxes display all the expected features. A comparison of zonally averaged wind stress components across ocean sub-basins reveals large differences between available products due both to winds and to the stress calculation. Regional comparisons of the heat and freshwater fluxes reveal an alarming range among alternatives; typically 40 W/m2 and 10 mg/m2 per second, respectively. The implied ocean heat transports are within the uncertainty of estimates from ocean observations in both the Atlantic and Indo-Pacific basins. They show about 2.4 PW of tropical heating, of which 80% is transported to the north, mostly in the Atlantic. There is similar good agreement in freshwater transport at many latitudes in both basins, but neither in the South Atlantic, nor at 35°N. read more read less

Topics:

Sea surface temperature (58%)58% related to the paper, Wind stress (58%)58% related to the paper, Ocean observations (53%)53% related to the paper, Wind speed (51%)51% related to the paper, Precipitation (50%)50% related to the paper
1,424 Citations
Author Pic

SciSpace is a very innovative solution to the formatting problem and existing providers, such as Mendeley or Word did not really evolve in recent years.

- Andreas Frutiger, Researcher, ETH Zurich, Institute for Biomedical Engineering

Get MS-Word and LaTeX output to any Journal within seconds
1
Choose a template
Select a template from a library of 40,000+ templates
2
Import a MS-Word file or start fresh
It takes only few seconds to import
3
View and edit your final output
SciSpace will automatically format your output to meet journal guidelines
4
Submit directly or Download
Submit to journal directly or Download in PDF, MS Word or LaTeX

(Before submission check for plagiarism via Turnitin)

clock Less than 3 minutes

What to expect from SciSpace?

Speed and accuracy over MS Word

''

With SciSpace, you do not need a word template for Climate Dynamics.

It automatically formats your research paper to Springer formatting guidelines and citation style.

You can download a submission ready research paper in pdf, LaTeX and docx formats.

Time comparison

Time taken to format a paper and Compliance with guidelines

Plagiarism Reports via Turnitin

SciSpace has partnered with Turnitin, the leading provider of Plagiarism Check software.

Using this service, researchers can compare submissions against more than 170 million scholarly articles, a database of 70+ billion current and archived web pages. How Turnitin Integration works?

Turnitin Stats
Publisher Logos

Freedom from formatting guidelines

One editor, 100K journal formats – world's largest collection of journal templates

With such a huge verified library, what you need is already there.

publisher-logos

Easy support from all your favorite tools

Climate Dynamics format uses SPBASIC citation style.

Automatically format and order your citations and bibliography in a click.

SciSpace allows imports from all reference managers like Mendeley, Zotero, Endnote, Google Scholar etc.

Frequently asked questions

1. Can I write Climate Dynamics in LaTeX?

Absolutely not! Our tool has been designed to help you focus on writing. You can write your entire paper as per the Climate Dynamics guidelines and auto format it.

2. Do you follow the Climate Dynamics guidelines?

Yes, the template is compliant with the Climate Dynamics guidelines. Our experts at SciSpace ensure that. If there are any changes to the journal's guidelines, we'll change our algorithm accordingly.

3. Can I cite my article in multiple styles in Climate Dynamics?

Of course! We support all the top citation styles, such as APA style, MLA style, Vancouver style, Harvard style, and Chicago style. For example, when you write your paper and hit autoformat, our system will automatically update your article as per the Climate Dynamics citation style.

4. Can I use the Climate Dynamics templates for free?

Sign up for our free trial, and you'll be able to use all our features for seven days. You'll see how helpful they are and how inexpensive they are compared to other options, Especially for Climate Dynamics.

5. Can I use a manuscript in Climate Dynamics that I have written in MS Word?

Yes. You can choose the right template, copy-paste the contents from the word document, and click on auto-format. Once you're done, you'll have a publish-ready paper Climate Dynamics that you can download at the end.

6. How long does it usually take you to format my papers in Climate Dynamics?

It only takes a matter of seconds to edit your manuscript. Besides that, our intuitive editor saves you from writing and formatting it in Climate Dynamics.

7. Where can I find the template for the Climate Dynamics?

It is possible to find the Word template for any journal on Google. However, why use a template when you can write your entire manuscript on SciSpace , auto format it as per Climate Dynamics's guidelines and download the same in Word, PDF and LaTeX formats? Give us a try!.

8. Can I reformat my paper to fit the Climate Dynamics's guidelines?

Of course! You can do this using our intuitive editor. It's very easy. If you need help, our support team is always ready to assist you.

9. Climate Dynamics an online tool or is there a desktop version?

SciSpace's Climate Dynamics is currently available as an online tool. We're developing a desktop version, too. You can request (or upvote) any features that you think would be helpful for you and other researchers in the "feature request" section of your account once you've signed up with us.

10. I cannot find my template in your gallery. Can you create it for me like Climate Dynamics?

Sure. You can request any template and we'll have it setup within a few days. You can find the request box in Journal Gallery on the right side bar under the heading, "Couldn't find the format you were looking for like Climate Dynamics?”

11. What is the output that I would get after using Climate Dynamics?

After writing your paper autoformatting in Climate Dynamics, you can download it in multiple formats, viz., PDF, Docx, and LaTeX.

12. Is Climate Dynamics's impact factor high enough that I should try publishing my article there?

To be honest, the answer is no. The impact factor is one of the many elements that determine the quality of a journal. Few of these factors include review board, rejection rates, frequency of inclusion in indexes, and Eigenfactor. You need to assess all these factors before you make your final call.

13. What is Sherpa RoMEO Archiving Policy for Climate Dynamics?

SHERPA/RoMEO Database

We extracted this data from Sherpa Romeo to help researchers understand the access level of this journal in accordance with the Sherpa Romeo Archiving Policy for Climate Dynamics. The table below indicates the level of access a journal has as per Sherpa Romeo's archiving policy.

RoMEO Colour Archiving policy
Green Can archive pre-print and post-print or publisher's version/PDF
Blue Can archive post-print (ie final draft post-refereeing) or publisher's version/PDF
Yellow Can archive pre-print (ie pre-refereeing)
White Archiving not formally supported
FYI:
  1. Pre-prints as being the version of the paper before peer review and
  2. Post-prints as being the version of the paper after peer-review, with revisions having been made.

14. What are the most common citation types In Climate Dynamics?

The 5 most common citation types in order of usage for Climate Dynamics are:.

S. No. Citation Style Type
1. Author Year
2. Numbered
3. Numbered (Superscripted)
4. Author Year (Cited Pages)
5. Footnote

15. How do I submit my article to the Climate Dynamics?

It is possible to find the Word template for any journal on Google. However, why use a template when you can write your entire manuscript on SciSpace , auto format it as per Climate Dynamics's guidelines and download the same in Word, PDF and LaTeX formats? Give us a try!.

16. Can I download Climate Dynamics in Endnote format?

Yes, SciSpace provides this functionality. After signing up, you would need to import your existing references from Word or Bib file to SciSpace. Then SciSpace would allow you to download your references in Climate Dynamics Endnote style according to Elsevier guidelines.

Fast and reliable,
built for complaince.

Instant formatting to 100% publisher guidelines on - SciSpace.
Available only on desktops 🖥

No word template required

Typset automatically formats your research paper to Climate Dynamics formatting guidelines and citation style.

Verifed journal formats

One editor, 100K journal formats.
With the largest collection of verified journal formats, what you need is already there.

Trusted by academicians

I spent hours with MS word for reformatting. It was frustrating - plain and simple. With SciSpace, I can draft my manuscripts and once it is finished I can just submit. In case, I have to submit to another journal it is really just a button click instead of an afternoon of reformatting.

Andreas Frutiger
Researcher & Ex MS Word user
Use this template