Example of Applied Spectroscopy format
Recent searches

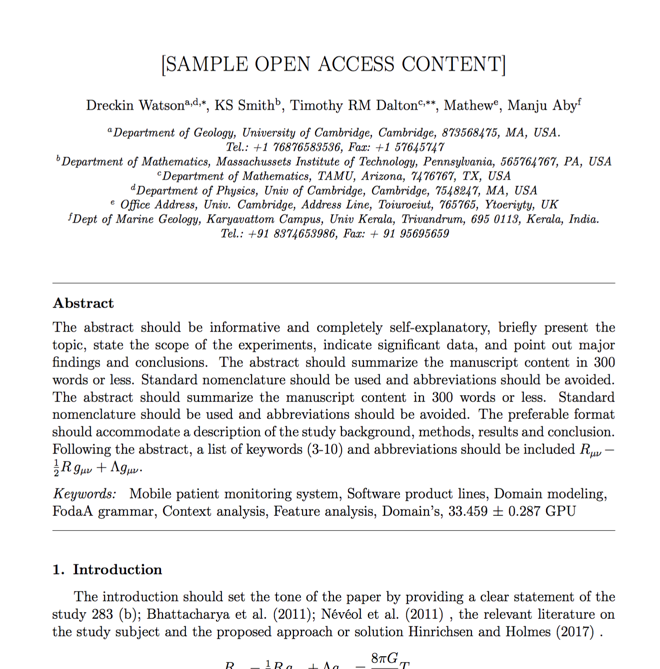
Example of Applied Spectroscopy format Example of Applied Spectroscopy format Example of Applied Spectroscopy format Example of Applied Spectroscopy format
Sample paper formatted on SciSpace - SciSpace
This content is only for preview purposes. The original open access content can be found here.
Look Inside
Example of Applied Spectroscopy format Example of Applied Spectroscopy format Example of Applied Spectroscopy format Example of Applied Spectroscopy format
Sample paper formatted on SciSpace - SciSpace
This content is only for preview purposes. The original open access content can be found here.
open access Open Access

Applied Spectroscopy — Template for authors

Publisher: The Optical Society
Categories Rank Trend in last 3 yrs
Instrumentation #22 of 128 up up by 23 ranks
Spectroscopy #32 of 74 up up by 8 ranks
journal-quality-icon Journal quality:
High
calendar-icon Last 4 years overview: 667 Published Papers | 2964 Citations
indexed-in-icon Indexed in: Scopus
last-updated-icon Last updated: 19/06/2020
Related journals
Insights
General info
Top papers
Popular templates
Get started guide
Why choose from SciSpace
FAQ

Related Journals

open access Open Access
recommended Recommended

Taylor and Francis

Quality:  
High
CiteRatio: 9.0
SJR: 0.984
SNIP: 2.03
open access Open Access
recommended Recommended

American Institute of Physics

Quality:  
High
CiteRatio: 6.1
SJR: 1.415
SNIP: 0.892
open access Open Access

Springer

Quality:  
Good
CiteRatio: 3.0
SJR: 0.406
SNIP: 0.549
open access Open Access

Hindawi

Quality:  
High
CiteRatio: 4.1
SJR: 0.399
SNIP: 1.108

Journal Performance & Insights

Impact Factor

CiteRatio

Determines the importance of a journal by taking a measure of frequency with which the average article in a journal has been cited in a particular year.

A measure of average citations received per peer-reviewed paper published in the journal.

2.087

1% from 2018

Impact factor for Applied Spectroscopy from 2016 - 2019
Year Value
2019 2.087
2018 2.064
2017 1.642
2016 1.529
graph view Graph view
table view Table view

4.4

16% from 2019

CiteRatio for Applied Spectroscopy from 2016 - 2020
Year Value
2020 4.4
2019 3.8
2018 3.3
2017 2.6
2016 3.1
graph view Graph view
table view Table view

insights Insights

  • Impact factor of this journal has increased by 1% in last year.
  • This journal’s impact factor is in the top 10 percentile category.

insights Insights

  • CiteRatio of this journal has increased by 16% in last years.
  • This journal’s CiteRatio is in the top 10 percentile category.

SCImago Journal Rank (SJR)

Source Normalized Impact per Paper (SNIP)

Measures weighted citations received by the journal. Citation weighting depends on the categories and prestige of the citing journal.

Measures actual citations received relative to citations expected for the journal's category.

0.415

15% from 2019

SJR for Applied Spectroscopy from 2016 - 2020
Year Value
2020 0.415
2019 0.486
2018 0.502
2017 0.489
2016 0.486
graph view Graph view
table view Table view

0.971

6% from 2019

SNIP for Applied Spectroscopy from 2016 - 2020
Year Value
2020 0.971
2019 1.033
2018 1.009
2017 0.876
2016 0.957
graph view Graph view
table view Table view

insights Insights

  • SJR of this journal has decreased by 15% in last years.
  • This journal’s SJR is in the top 10 percentile category.

insights Insights

  • SNIP of this journal has decreased by 6% in last years.
  • This journal’s SNIP is in the top 10 percentile category.

Applied Spectroscopy

Guideline source: View

All company, product and service names used in this website are for identification purposes only. All product names, trademarks and registered trademarks are property of their respective owners.

Use of these names, trademarks and brands does not imply endorsement or affiliation. Disclaimer Notice

The Optical Society

Applied Spectroscopy

Applied Spectroscopy covers applications in analytical chemistry, materials science, biotechnology, and chemical characterization. It is published by the Society for Applied Spectroscopy and available from SAS and OSA.... Read More

i
Last updated on
19 Jun 2020
i
ISSN
1943-3530
i
Impact Factor
High - 1.529
i
Open Access
No
i
Sherpa RoMEO Archiving Policy
Green faq
i
Plagiarism Check
Available via Turnitin
i
Endnote Style
Download Available
i
Bibliography Name
unsrt
i
Citation Type
Numbered
[25]
i
Bibliography Example
C. W. J. Beenakker. Specular andreev reflection in graphene. Phys. Rev. Lett., 97(6):067007, 2006.

Top papers written in this journal

Journal Article DOI: 10.1366/0003702934067694
Generalized Two-Dimensional Correlation Method Applicable to Infrared, Raman, and other Types of Spectroscopy:
Isao Noda1
01 Sep 1993 - Applied Spectroscopy

Abstract:

A two-dimensional (2D) correlation method generally applicable to various types of spectroscopy, including IR and Raman spectroscopy, is introduced In the proposed 2D correlation scheme, an external perturbation is applied to a system while being monitored by an electromagnetic probe With the application of a correlation anal... A two-dimensional (2D) correlation method generally applicable to various types of spectroscopy, including IR and Raman spectroscopy, is introduced In the proposed 2D correlation scheme, an external perturbation is applied to a system while being monitored by an electromagnetic probe With the application of a correlation analysis to spectral intensity fluctuations induced by the perturbation, new types of spectra defined by two independent spectral variable axes are obtained Such two-dimensional correlation spectra emphasize spectral features not readily observable in conventional one-dimensional spectra While a similar 2D correlation formalism has already been developed in the past for analysis of simple sinusoidally varying IR signals, the newly proposed formalism is designed to handle signals fluctuating as an arbitrary function of time, or any other physical variable This development makes the 2D correlation approach a universal spectroscopic tool, generally applicable to a very wide range of applications The basic property of 2D correlation spectra obtained by the new method is described first, and several spectral data sets are analyzed by the proposed scheme to demonstrate the utility of generalized 2D correlation spectra Potential applications of this 2D correlation approach are then explored read more read less

Topics:

Two-dimensional correlation analysis (60%)60% related to the paper, Spectroscopy (50%)50% related to the paper
1,566 Citations
Journal Article DOI: 10.1366/0003702854248656
Linearization and Scatter-Correction for Near-Infrared Reflectance Spectra of Meat
P. Geladi, D. MacDougall, Harald Martens
01 May 1985 - Applied Spectroscopy

Abstract:

This paper is concerned with the quantitative analysis of multicomponent mixtures by diffuse reflectance spectroscopy. Near-infrared reflectance (NIRR) measurements are related to chemical composition but in a nonlinear way, and light scatter distorts the data. Various response linearizations of reflectance (R) are compared (... This paper is concerned with the quantitative analysis of multicomponent mixtures by diffuse reflectance spectroscopy. Near-infrared reflectance (NIRR) measurements are related to chemical composition but in a nonlinear way, and light scatter distorts the data. Various response linearizations of reflectance (R) are compared (R with Saunderson correction for internal reflectance, log 1/R, and Kubelka-Munk transformations and its inverse). A multi-wavelength concept for optical correction (Multiplicative Scatter Correction, MSC) is proposed for separating the chemical light absorption from the physical light scatter. Partial Least Squares (PLS) regression is used as the multivariate linear calibration method for predicting fat in meat from linearized and scatter-corrected NIRR data over a broad concentration range. All the response linearization methods improved fat prediction when used with the MSC; corrected log 1/R and inverse Kubelka-Munk transformations yielded the best results. The MSC provided simpler calibration models with good correspondence to the expected physical model of meat. The scatter coefficients obtained from the MSC correlated with fat content, indicating that fat affects the NIRR of meat with an additive absorption component and a multiplicative scatter component. read more read less

Topics:

Light intensity (53%)53% related to the paper, Diffuse reflectance infrared fourier transform (52%)52% related to the paper
1,309 Citations
Journal Article DOI: 10.1366/0003702814732634
Fourier Self-Deconvolution: A Method for Resolving Intrinsically Overlapped Bands
Jyrki K. Kauppinen1, Douglas J. Moffatt1, Henry H. Mantsch1, David G. Cameron1
01 May 1981 - Applied Spectroscopy

Abstract:

The general theory of Fourier self-deconvolution, i.e., spectral deconvolution using Fourier transforms and the intrinsic line-shape, is developed. The method provides a way of computationally resolving overlapped lines that can not be instrumentally resolved due to their intrinsic linewidth. Examples of the application of th... The general theory of Fourier self-deconvolution, i.e., spectral deconvolution using Fourier transforms and the intrinsic line-shape, is developed. The method provides a way of computationally resolving overlapped lines that can not be instrumentally resolved due to their intrinsic linewidth. Examples of the application of the technique to synthetic and experimental infrared spectra are presented, and potential applications are discussed. It is shown that lines in spectra having moderate signal/noise ratios (∼1000) can readily be reduced in width by a factor of 3. The method is applicable to a variety of spectroscopic techniques. read more read less

Topics:

Deconvolution (61%)61% related to the paper, Fourier transform (55%)55% related to the paper
1,213 Citations
Journal Article DOI: 10.1366/0003702001949500
Interval Partial Least-Squares Regression (iPLS): A Comparative Chemometric Study with an Example from Near-Infrared Spectroscopy
01 Mar 2000 - Applied Spectroscopy

Abstract:

A new graphically oriented local modeling procedure called interval partial least-squares (i PLS) is presented for use on spectral data. The i PLS method is compared to full-spectrum partial least-squares and the variable selection methods principal variables (PV), forward stepwise selection (FSS), and recursively weighted re... A new graphically oriented local modeling procedure called interval partial least-squares (i PLS) is presented for use on spectral data. The i PLS method is compared to full-spectrum partial least-squares and the variable selection methods principal variables (PV), forward stepwise selection (FSS), and recursively weighted regression (RWR). The methods are tested on a near-infrared (NIR) spectral data set recorded on 60 beer samples correlated to original extract concentration. The error of the full-spectrum correlation model between NIR and original extract concentration was reduced by a factor of 4 with the use of i PLS (r=0.998, and root mean square error of prediction equal to 0.17% plato), and the graphic output contributed to the interpretation of the chemical system under observation. The other methods tested gave a comparable reduction in the prediction error but suffered from the interpretation advantage of the graphic interface. The intervals chosen by i PLS cover both the variables found by FSS and all possible combinations as well as the variables found by PV and RWR, and i PLS is still able to utilize the first-order advantage. Index Headings: Interval PLS; Variable selection; NIR, Principal variables; Forward stepwise selection; Recursively weighted regression; Beer; Extract. read more read less

Topics:

Partial least squares regression (61%)61% related to the paper
1,190 Citations
Author Pic

SciSpace is a very innovative solution to the formatting problem and existing providers, such as Mendeley or Word did not really evolve in recent years.

- Andreas Frutiger, Researcher, ETH Zurich, Institute for Biomedical Engineering

Get MS-Word and LaTeX output to any Journal within seconds
1
Choose a template
Select a template from a library of 40,000+ templates
2
Import a MS-Word file or start fresh
It takes only few seconds to import
3
View and edit your final output
SciSpace will automatically format your output to meet journal guidelines
4
Submit directly or Download
Submit to journal directly or Download in PDF, MS Word or LaTeX

(Before submission check for plagiarism via Turnitin)

clock Less than 3 minutes

What to expect from SciSpace?

Speed and accuracy over MS Word

''

With SciSpace, you do not need a word template for Applied Spectroscopy.

It automatically formats your research paper to The Optical Society formatting guidelines and citation style.

You can download a submission ready research paper in pdf, LaTeX and docx formats.

Time comparison

Time taken to format a paper and Compliance with guidelines

Plagiarism Reports via Turnitin

SciSpace has partnered with Turnitin, the leading provider of Plagiarism Check software.

Using this service, researchers can compare submissions against more than 170 million scholarly articles, a database of 70+ billion current and archived web pages. How Turnitin Integration works?

Turnitin Stats
Publisher Logos

Freedom from formatting guidelines

One editor, 100K journal formats – world's largest collection of journal templates

With such a huge verified library, what you need is already there.
publisher-logos

Easy support from all your favorite tools

Applied Spectroscopy format uses unsrt citation style.

Automatically format and order your citations and bibliography in a click.

SciSpace allows imports from all reference managers like Mendeley, Zotero, Endnote, Google Scholar etc.

Frequently asked questions

1. Can I write Applied Spectroscopy in LaTeX?

Absolutely not! Our tool has been designed to help you focus on writing. You can write your entire paper as per the Applied Spectroscopy guidelines and auto format it.

2. Do you follow the Applied Spectroscopy guidelines?

Yes, the template is compliant with the Applied Spectroscopy guidelines. Our experts at SciSpace ensure that. If there are any changes to the journal's guidelines, we'll change our algorithm accordingly.

3. Can I cite my article in multiple styles in Applied Spectroscopy?

Of course! We support all the top citation styles, such as APA style, MLA style, Vancouver style, Harvard style, and Chicago style. For example, when you write your paper and hit autoformat, our system will automatically update your article as per the Applied Spectroscopy citation style.

4. Can I use the Applied Spectroscopy templates for free?

Sign up for our free trial, and you'll be able to use all our features for seven days. You'll see how helpful they are and how inexpensive they are compared to other options, Especially for Applied Spectroscopy.

5. Can I use a manuscript in Applied Spectroscopy that I have written in MS Word?

Yes. You can choose the right template, copy-paste the contents from the word document, and click on auto-format. Once you're done, you'll have a publish-ready paper Applied Spectroscopy that you can download at the end.

6. How long does it usually take you to format my papers in Applied Spectroscopy?

It only takes a matter of seconds to edit your manuscript. Besides that, our intuitive editor saves you from writing and formatting it in Applied Spectroscopy.

7. Where can I find the template for the Applied Spectroscopy?

It is possible to find the Word template for any journal on Google. However, why use a template when you can write your entire manuscript on SciSpace , auto format it as per Applied Spectroscopy's guidelines and download the same in Word, PDF and LaTeX formats? Give us a try!.

8. Can I reformat my paper to fit the Applied Spectroscopy's guidelines?

Of course! You can do this using our intuitive editor. It's very easy. If you need help, our support team is always ready to assist you.

9. Applied Spectroscopy an online tool or is there a desktop version?

SciSpace's Applied Spectroscopy is currently available as an online tool. We're developing a desktop version, too. You can request (or upvote) any features that you think would be helpful for you and other researchers in the "feature request" section of your account once you've signed up with us.

10. I cannot find my template in your gallery. Can you create it for me like Applied Spectroscopy?

Sure. You can request any template and we'll have it setup within a few days. You can find the request box in Journal Gallery on the right side bar under the heading, "Couldn't find the format you were looking for like Applied Spectroscopy?”

11. What is the output that I would get after using Applied Spectroscopy?

After writing your paper autoformatting in Applied Spectroscopy, you can download it in multiple formats, viz., PDF, Docx, and LaTeX.

12. Is Applied Spectroscopy's impact factor high enough that I should try publishing my article there?

To be honest, the answer is no. The impact factor is one of the many elements that determine the quality of a journal. Few of these factors include review board, rejection rates, frequency of inclusion in indexes, and Eigenfactor. You need to assess all these factors before you make your final call.

13. What is Sherpa RoMEO Archiving Policy for Applied Spectroscopy?

SHERPA/RoMEO Database

We extracted this data from Sherpa Romeo to help researchers understand the access level of this journal in accordance with the Sherpa Romeo Archiving Policy for Applied Spectroscopy. The table below indicates the level of access a journal has as per Sherpa Romeo's archiving policy.

RoMEO Colour Archiving policy
Green Can archive pre-print and post-print or publisher's version/PDF
Blue Can archive post-print (ie final draft post-refereeing) or publisher's version/PDF
Yellow Can archive pre-print (ie pre-refereeing)
White Archiving not formally supported
FYI:
  1. Pre-prints as being the version of the paper before peer review and
  2. Post-prints as being the version of the paper after peer-review, with revisions having been made.

14. What are the most common citation types In Applied Spectroscopy?

The 5 most common citation types in order of usage for Applied Spectroscopy are:.

S. No. Citation Style Type
1. Author Year
2. Numbered
3. Numbered (Superscripted)
4. Author Year (Cited Pages)
5. Footnote

15. How do I submit my article to the Applied Spectroscopy?

It is possible to find the Word template for any journal on Google. However, why use a template when you can write your entire manuscript on SciSpace , auto format it as per Applied Spectroscopy's guidelines and download the same in Word, PDF and LaTeX formats? Give us a try!.

16. Can I download Applied Spectroscopy in Endnote format?

Yes, SciSpace provides this functionality. After signing up, you would need to import your existing references from Word or Bib file to SciSpace. Then SciSpace would allow you to download your references in Applied Spectroscopy Endnote style according to Elsevier guidelines.

Fast and reliable,
built for complaince.

Instant formatting to 100% publisher guidelines on - SciSpace.
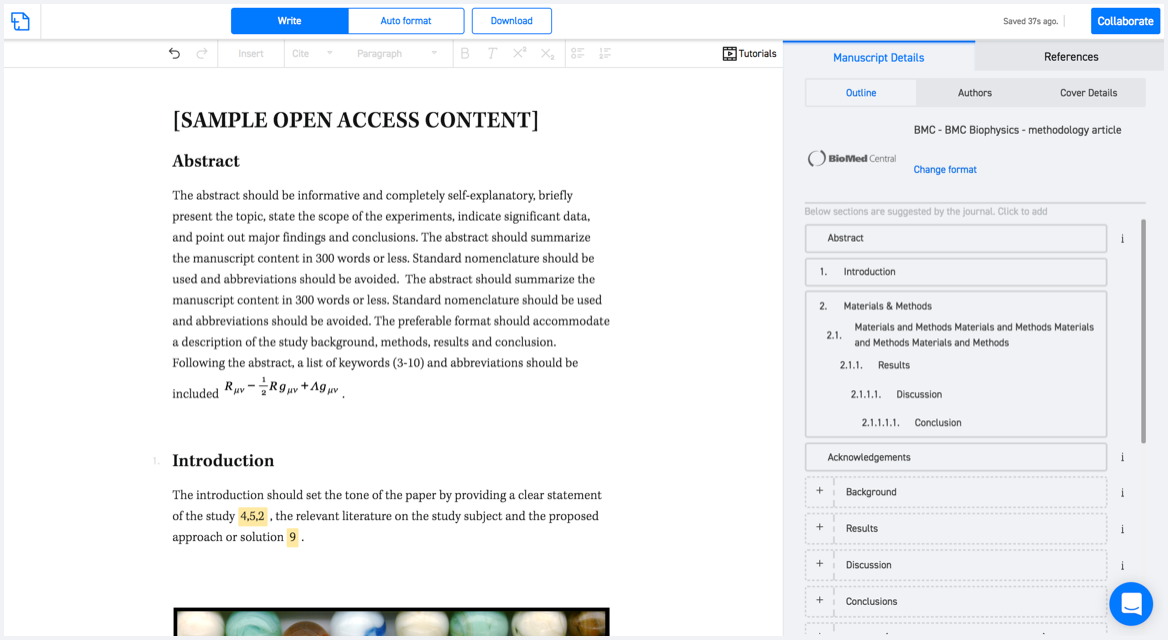
Available only on desktops 🖥

No word template required

Typset automatically formats your research paper to Applied Spectroscopy formatting guidelines and citation style.
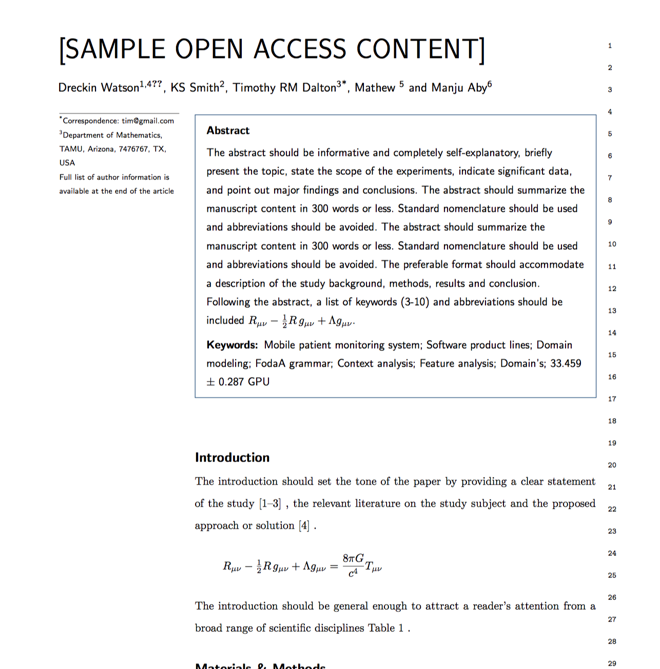
Verifed journal formats

One editor, 100K journal formats.
With the largest collection of verified journal formats, what you need is already there.

Trusted by academicians

I spent hours with MS word for reformatting. It was frustrating - plain and simple. With SciSpace, I can draft my manuscripts and once it is finished I can just submit. In case, I have to submit to another journal it is really just a button click instead of an afternoon of reformatting.

Andreas Frutiger
Researcher & Ex MS Word user
Use this template