Example of Statistics in Medicine format
Recent searches

Example of Statistics in Medicine format Example of Statistics in Medicine format Example of Statistics in Medicine format Example of Statistics in Medicine format Example of Statistics in Medicine format Example of Statistics in Medicine format Example of Statistics in Medicine format Example of Statistics in Medicine format Example of Statistics in Medicine format Example of Statistics in Medicine format Example of Statistics in Medicine format Example of Statistics in Medicine format Example of Statistics in Medicine format Example of Statistics in Medicine format Example of Statistics in Medicine format Example of Statistics in Medicine format Example of Statistics in Medicine format Example of Statistics in Medicine format Example of Statistics in Medicine format
Sample paper formatted on SciSpace - SciSpace
This content is only for preview purposes. The original open access content can be found here.
Look Inside
Example of Statistics in Medicine format Example of Statistics in Medicine format Example of Statistics in Medicine format Example of Statistics in Medicine format Example of Statistics in Medicine format Example of Statistics in Medicine format Example of Statistics in Medicine format Example of Statistics in Medicine format Example of Statistics in Medicine format Example of Statistics in Medicine format Example of Statistics in Medicine format Example of Statistics in Medicine format Example of Statistics in Medicine format Example of Statistics in Medicine format Example of Statistics in Medicine format Example of Statistics in Medicine format Example of Statistics in Medicine format Example of Statistics in Medicine format Example of Statistics in Medicine format
Sample paper formatted on SciSpace - SciSpace
This content is only for preview purposes. The original open access content can be found here.
open access Open Access

Statistics in Medicine — Template for authors

Publisher: Wiley
Categories Rank Trend in last 3 yrs
Statistics and Probability #47 of 239 down down by 19 ranks
Epidemiology #58 of 99 down down by 5 ranks
journal-quality-icon Journal quality:
High
calendar-icon Last 4 years overview: 1251 Published Papers | 4292 Citations
indexed-in-icon Indexed in: Scopus
last-updated-icon Last updated: 15/07/2020
Related journals
Insights
General info
Top papers
Popular templates
Get started guide
Why choose from SciSpace
FAQ

Related Journals

open access Open Access
recommended Recommended

Taylor and Francis

Quality:  
High
CiteRatio: 5.9
SJR: 5.062
SNIP: 4.015
open access Open Access
recommended Recommended

Cambridge University Press

Quality:  
High
CiteRatio: 8.4
SJR: 1.718
SNIP: 1.845
open access Open Access
recommended Recommended

Oxford University Press

Quality:  
High
CiteRatio: 9.9
SJR: 3.599
SNIP: 2.056
open access Open Access
recommended Recommended

American Society for Microbiology

Quality:  
High
CiteRatio: 39.4
SJR: 9.177
SNIP: 10.528

Journal Performance & Insights

Impact Factor

CiteRatio

Determines the importance of a journal by taking a measure of frequency with which the average article in a journal has been cited in a particular year.

A measure of average citations received per peer-reviewed paper published in the journal.

1.783

3% from 2018

Impact factor for Statistics in Medicine from 2016 - 2019
Year Value
2019 1.783
2018 1.847
2017 1.932
2016 1.861
graph view Graph view
table view Table view

3.4

3% from 2019

CiteRatio for Statistics in Medicine from 2016 - 2020
Year Value
2020 3.4
2019 3.3
2018 3.4
2017 3.4
2016 3.4
graph view Graph view
table view Table view

insights Insights

  • Impact factor of this journal has decreased by 3% in last year.
  • This journal’s impact factor is in the top 10 percentile category.

insights Insights

  • CiteRatio of this journal has increased by 3% in last years.
  • This journal’s CiteRatio is in the top 10 percentile category.

SCImago Journal Rank (SJR)

Source Normalized Impact per Paper (SNIP)

Measures weighted citations received by the journal. Citation weighting depends on the categories and prestige of the citing journal.

Measures actual citations received relative to citations expected for the journal's category.

1.996

10% from 2019

SJR for Statistics in Medicine from 2016 - 2020
Year Value
2020 1.996
2019 1.822
2018 2.047
2017 2.375
2016 2.038
graph view Graph view
table view Table view

1.61

6% from 2019

SNIP for Statistics in Medicine from 2016 - 2020
Year Value
2020 1.61
2019 1.518
2018 1.413
2017 1.435
2016 1.373
graph view Graph view
table view Table view

insights Insights

  • SJR of this journal has increased by 10% in last years.
  • This journal’s SJR is in the top 10 percentile category.

insights Insights

  • SNIP of this journal has increased by 6% in last years.
  • This journal’s SNIP is in the top 10 percentile category.
Statistics in Medicine

Guideline source: View

All company, product and service names used in this website are for identification purposes only. All product names, trademarks and registered trademarks are property of their respective owners.

Use of these names, trademarks and brands does not imply endorsement or affiliation. Disclaimer Notice
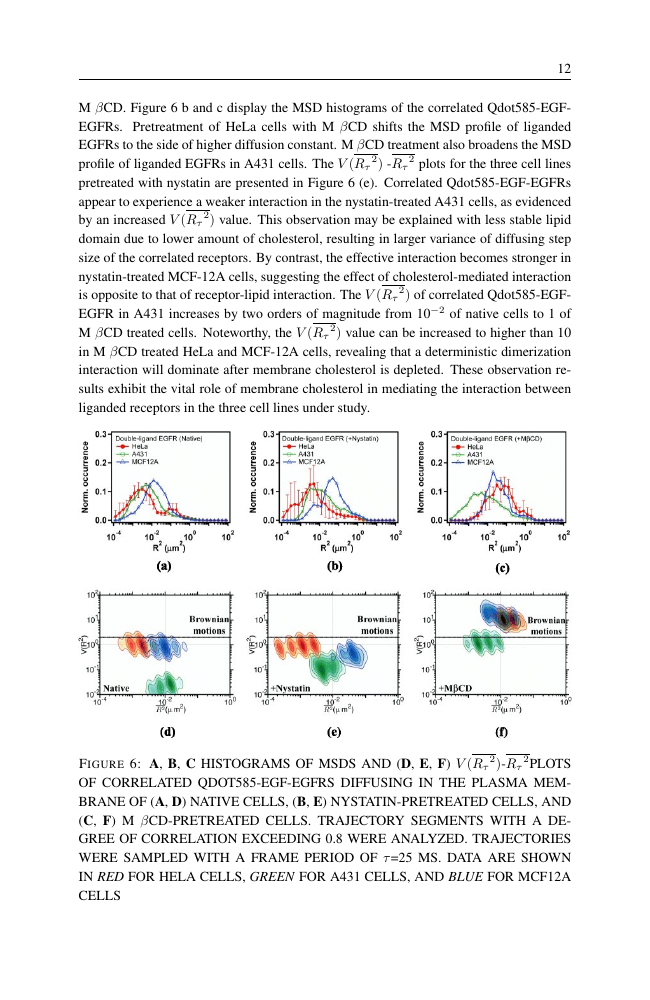
Wiley

Statistics in Medicine

The journal aims to influence practice in medicine and its associated sciences through the publication of papers on statistical and other quantitative methods. Papers will explain new methods and either demonstrate their application, preferably through a substantive, real, mot...... Read More
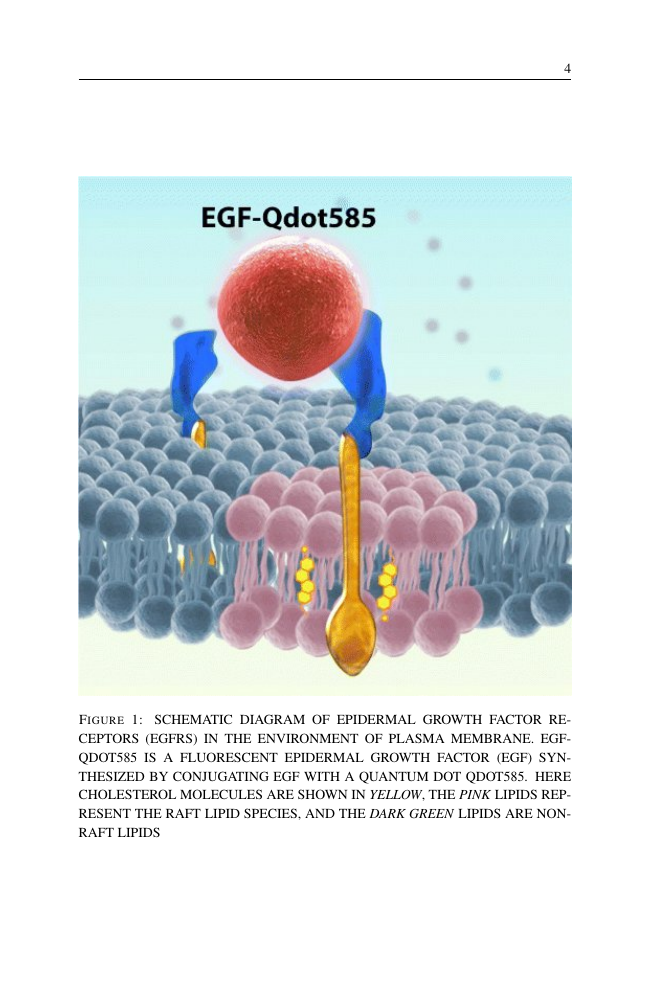
Statistics and Probability

Epidemiology

Mathematics

i
Last updated on
15 Jul 2020
i
ISSN
0277-6715
i
Impact Factor
High - 1.375
i
Open Access
Yes
i
Sherpa RoMEO Archiving Policy
Yellow faq
i
Plagiarism Check
Available via Turnitin
i
Endnote Style
Download Available
i
Bibliography Name
apa
i
Citation Type
Numbered
[25]
i
Bibliography Example
Beenakker, C.W.J. (2006) Specular andreev reflection in graphene.Phys. Rev. Lett., 97 (6), 067 007. URL 10.1103/PhysRevLett.97.067007.

Top papers written in this journal

Journal Article DOI: 10.1002/SIM.1186
Quantifying heterogeneity in a meta‐analysis
15 Jun 2002 - Statistics in Medicine

Abstract:

The extent of heterogeneity in a meta-analysis partly determines the difficulty in drawing overall conclusions. This extent may be measured by estimating a between-study variance, but interpretation is then specific to a particular treatment effect metric. A test for the existence of heterogeneity exists, but depends on the n... The extent of heterogeneity in a meta-analysis partly determines the difficulty in drawing overall conclusions. This extent may be measured by estimating a between-study variance, but interpretation is then specific to a particular treatment effect metric. A test for the existence of heterogeneity exists, but depends on the number of studies in the meta-analysis. We develop measures of the impact of heterogeneity on a meta-analysis, from mathematical criteria, that are independent of the number of studies and the treatment effect metric. We derive and propose three suitable statistics: H is the square root of the chi2 heterogeneity statistic divided by its degrees of freedom; R is the ratio of the standard error of the underlying mean from a random effects meta-analysis to the standard error of a fixed effect meta-analytic estimate, and I2 is a transformation of (H) that describes the proportion of total variation in study estimates that is due to heterogeneity. We discuss interpretation, interval estimates and other properties of these measures and examine them in five example data sets showing different amounts of heterogeneity. We conclude that H and I2, which can usually be calculated for published meta-analyses, are particularly useful summaries of the impact of heterogeneity. One or both should be presented in published meta-analyses in preference to the test for heterogeneity. read more read less

Topics:

Study heterogeneity (75%)75% related to the paper, Random effects model (54%)54% related to the paper, Funnel plot (51%)51% related to the paper, Q-statistic (51%)51% related to the paper, Standard error (50%)50% related to the paper
25,460 Citations
Multivariable prognostic models: issues in developing models, evaluating assumptions and adequacy, and measuring and reducing errors
Frank E. Harrell1, Kerry L. Lee1, Daniel B. Mark1
29 Feb 1996 - Statistics in Medicine

Abstract:

Multivariable regression models are powerful tools that are used frequently in studies of clinical outcomes. These models can use a mixture of categorical and continuous variables and can handle partially observed (censored) responses. However, uncritical application of modelling techniques can result in models that poorly fi... Multivariable regression models are powerful tools that are used frequently in studies of clinical outcomes. These models can use a mixture of categorical and continuous variables and can handle partially observed (censored) responses. However, uncritical application of modelling techniques can result in models that poorly fit the dataset at hand, or, even more likely, inaccurately predict outcomes on new subjects. One must know how to measure qualities of a model's fit in order to avoid poorly fitted or overfitted models. Measurement of predictive accuracy can be difficult for survival time data in the presence of censoring. We discuss an easily interpretable index of predictive discrimination as well as methods for assessing calibration of predicted survival probabilities. Both types of predictive accuracy should be unbiasedly validated using bootstrapping or cross-validation, before using predictions in a new data series. We discuss some of the hazards of poorly fitted and overfitted regression models and present one modelling strategy that avoids many of the problems discussed. The methods described are applicable to all regression models, but are particularly needed for binary, ordinal, and time-to-event outcomes. Methods are illustrated with a survival analysis in prostate cancer using Cox regression. read more read less

Topics:

Categorical variable (54%)54% related to the paper, Linear model (54%)54% related to the paper, Regression analysis (54%)54% related to the paper, Censoring (clinical trials) (52%)52% related to the paper, Proportional hazards model (50%)50% related to the paper
View PDF
7,879 Citations
Journal Article DOI: 10.1002/SIM.4067
Multiple imputation using chained equations: Issues and guidance for practice
Ian R. White, Patrick Royston1, Angela M. Wood2
20 Feb 2011 - Statistics in Medicine

Abstract:

Multiple imputation by chained equations is a flexible and practical approach to handling missing data. We describe the principles of the method and show how to impute categorical and quantitative variables, including skewed variables. We give guidance on how to specify the imputation model and how many imputations are needed... Multiple imputation by chained equations is a flexible and practical approach to handling missing data. We describe the principles of the method and show how to impute categorical and quantitative variables, including skewed variables. We give guidance on how to specify the imputation model and how many imputations are needed. We describe the practical analysis of multiply imputed data, including model building and model checking. We stress the limitations of the method and discuss the possible pitfalls. We illustrate the ideas using a data set in mental health, giving Stata code fragments. Copyright © 2010 John Wiley & Sons, Ltd. read more read less

Topics:

Imputation (statistics) (63%)63% related to the paper, Categorical variable (52%)52% related to the paper, Missing data (51%)51% related to the paper
6,349 Citations
open accessOpen access Journal Article DOI: 10.1002/SIM.2929
Evaluating the added predictive ability of a new marker: From area under the ROC curve to reclassification and beyond
Michael J. Pencina1, Ralph B. D'Agostino1, Ramachandran S. Vasan1
30 Jan 2008 - Statistics in Medicine

Abstract:

Identification of key factors associated with the risk of developing cardiovascular disease and quantification of this risk using multivariable prediction algorithms are among the major advances made in preventive cardiology and cardiovascular epidemiology in the 20th century. The ongoing discovery of new risk markers by scie... Identification of key factors associated with the risk of developing cardiovascular disease and quantification of this risk using multivariable prediction algorithms are among the major advances made in preventive cardiology and cardiovascular epidemiology in the 20th century. The ongoing discovery of new risk markers by scientists presents opportunities and challenges for statisticians and clinicians to evaluate these biomarkers and to develop new risk formulations that incorporate them. One of the key questions is how best to assess and quantify the improvement in risk prediction offered by these new models. Demonstration of a statistically significant association of a new biomarker with cardiovascular risk is not enough. Some researchers have advanced that the improvement in the area under the receiver-operating-characteristic curve (AUC) should be the main criterion, whereas others argue that better measures of performance of prediction models are needed. In this paper, we address this question by introducing two new measures, one based on integrated sensitivity and specificity and the other on reclassification tables. These new measures offer incremental information over the AUC. We discuss the properties of these new measures and contrast them with the AUC. We also develop simple asymptotic tests of significance. We illustrate the use of these measures with an example from the Framingham Heart Study. We propose that scientists consider these types of measures in addition to the AUC when assessing the performance of newer biomarkers. read more read less
5,651 Citations
Propensity score methods for bias reduction in the comparison of a treatment to a non‐randomized control group
Ralph B. D'Agostino1
15 Oct 1998 - Statistics in Medicine

Abstract:

In observational studies, investigators have no control over the treatment assignment. The treated and non-treated (that is, control) groups may have large differences on their observed covariates, and these differences can lead to biased estimates of treatment effects. Even traditional covariance analysis adjustments may be ... In observational studies, investigators have no control over the treatment assignment. The treated and non-treated (that is, control) groups may have large differences on their observed covariates, and these differences can lead to biased estimates of treatment effects. Even traditional covariance analysis adjustments may be inadequate to eliminate this bias. The propensity score, defined as the conditional probability of being treated given the covariates, can be used to balance the covariates in the two groups, and therefore reduce this bias. In order to estimate the propensity score, one must model the distribution of the treatment indicator variable given the observed covariates. Once estimated the propensity score can be used to reduce bias through matching, stratification (subclassification), regression adjustment, or some combination of all three. In this tutorial we discuss the uses of propensity score methods for bias reduction, give references to the literature and illustrate the uses through applied examples. read more read less

Topics:

Propensity score matching (64%)64% related to the paper, Matching (statistics) (58%)58% related to the paper, Observational study (53%)53% related to the paper, Analysis of covariance (53%)53% related to the paper, Test score (52%)52% related to the paper
4,948 Citations
Author Pic

SciSpace is a very innovative solution to the formatting problem and existing providers, such as Mendeley or Word did not really evolve in recent years.

- Andreas Frutiger, Researcher, ETH Zurich, Institute for Biomedical Engineering

Get MS-Word and LaTeX output to any Journal within seconds
1
Choose a template
Select a template from a library of 40,000+ templates
2
Import a MS-Word file or start fresh
It takes only few seconds to import
3
View and edit your final output
SciSpace will automatically format your output to meet journal guidelines
4
Submit directly or Download
Submit to journal directly or Download in PDF, MS Word or LaTeX

(Before submission check for plagiarism via Turnitin)

clock Less than 3 minutes

What to expect from SciSpace?

Speed and accuracy over MS Word

''

With SciSpace, you do not need a word template for Statistics in Medicine.

It automatically formats your research paper to Wiley formatting guidelines and citation style.

You can download a submission ready research paper in pdf, LaTeX and docx formats.

Time comparison

Time taken to format a paper and Compliance with guidelines

Plagiarism Reports via Turnitin

SciSpace has partnered with Turnitin, the leading provider of Plagiarism Check software.

Using this service, researchers can compare submissions against more than 170 million scholarly articles, a database of 70+ billion current and archived web pages. How Turnitin Integration works?

Turnitin Stats
Publisher Logos

Freedom from formatting guidelines

One editor, 100K journal formats – world's largest collection of journal templates

With such a huge verified library, what you need is already there.

publisher-logos

Easy support from all your favorite tools

Statistics in Medicine format uses apa citation style.

Automatically format and order your citations and bibliography in a click.

SciSpace allows imports from all reference managers like Mendeley, Zotero, Endnote, Google Scholar etc.

Frequently asked questions

1. Can I write Statistics in Medicine in LaTeX?

Absolutely not! Our tool has been designed to help you focus on writing. You can write your entire paper as per the Statistics in Medicine guidelines and auto format it.

2. Do you follow the Statistics in Medicine guidelines?

Yes, the template is compliant with the Statistics in Medicine guidelines. Our experts at SciSpace ensure that. If there are any changes to the journal's guidelines, we'll change our algorithm accordingly.

3. Can I cite my article in multiple styles in Statistics in Medicine?

Of course! We support all the top citation styles, such as APA style, MLA style, Vancouver style, Harvard style, and Chicago style. For example, when you write your paper and hit autoformat, our system will automatically update your article as per the Statistics in Medicine citation style.

4. Can I use the Statistics in Medicine templates for free?

Sign up for our free trial, and you'll be able to use all our features for seven days. You'll see how helpful they are and how inexpensive they are compared to other options, Especially for Statistics in Medicine.

5. Can I use a manuscript in Statistics in Medicine that I have written in MS Word?

Yes. You can choose the right template, copy-paste the contents from the word document, and click on auto-format. Once you're done, you'll have a publish-ready paper Statistics in Medicine that you can download at the end.

6. How long does it usually take you to format my papers in Statistics in Medicine?

It only takes a matter of seconds to edit your manuscript. Besides that, our intuitive editor saves you from writing and formatting it in Statistics in Medicine.

7. Where can I find the template for the Statistics in Medicine?

It is possible to find the Word template for any journal on Google. However, why use a template when you can write your entire manuscript on SciSpace , auto format it as per Statistics in Medicine's guidelines and download the same in Word, PDF and LaTeX formats? Give us a try!.

8. Can I reformat my paper to fit the Statistics in Medicine's guidelines?

Of course! You can do this using our intuitive editor. It's very easy. If you need help, our support team is always ready to assist you.

9. Statistics in Medicine an online tool or is there a desktop version?

SciSpace's Statistics in Medicine is currently available as an online tool. We're developing a desktop version, too. You can request (or upvote) any features that you think would be helpful for you and other researchers in the "feature request" section of your account once you've signed up with us.

10. I cannot find my template in your gallery. Can you create it for me like Statistics in Medicine?

Sure. You can request any template and we'll have it setup within a few days. You can find the request box in Journal Gallery on the right side bar under the heading, "Couldn't find the format you were looking for like Statistics in Medicine?”

11. What is the output that I would get after using Statistics in Medicine?

After writing your paper autoformatting in Statistics in Medicine, you can download it in multiple formats, viz., PDF, Docx, and LaTeX.

12. Is Statistics in Medicine's impact factor high enough that I should try publishing my article there?

To be honest, the answer is no. The impact factor is one of the many elements that determine the quality of a journal. Few of these factors include review board, rejection rates, frequency of inclusion in indexes, and Eigenfactor. You need to assess all these factors before you make your final call.

13. What is Sherpa RoMEO Archiving Policy for Statistics in Medicine?

SHERPA/RoMEO Database

We extracted this data from Sherpa Romeo to help researchers understand the access level of this journal in accordance with the Sherpa Romeo Archiving Policy for Statistics in Medicine. The table below indicates the level of access a journal has as per Sherpa Romeo's archiving policy.

RoMEO Colour Archiving policy
Green Can archive pre-print and post-print or publisher's version/PDF
Blue Can archive post-print (ie final draft post-refereeing) or publisher's version/PDF
Yellow Can archive pre-print (ie pre-refereeing)
White Archiving not formally supported
FYI:
  1. Pre-prints as being the version of the paper before peer review and
  2. Post-prints as being the version of the paper after peer-review, with revisions having been made.

14. What are the most common citation types In Statistics in Medicine?

The 5 most common citation types in order of usage for Statistics in Medicine are:.

S. No. Citation Style Type
1. Author Year
2. Numbered
3. Numbered (Superscripted)
4. Author Year (Cited Pages)
5. Footnote

15. How do I submit my article to the Statistics in Medicine?

It is possible to find the Word template for any journal on Google. However, why use a template when you can write your entire manuscript on SciSpace , auto format it as per Statistics in Medicine's guidelines and download the same in Word, PDF and LaTeX formats? Give us a try!.

16. Can I download Statistics in Medicine in Endnote format?

Yes, SciSpace provides this functionality. After signing up, you would need to import your existing references from Word or Bib file to SciSpace. Then SciSpace would allow you to download your references in Statistics in Medicine Endnote style according to Elsevier guidelines.

Fast and reliable,
built for complaince.

Instant formatting to 100% publisher guidelines on - SciSpace.

Available only on desktops 🖥

No word template required

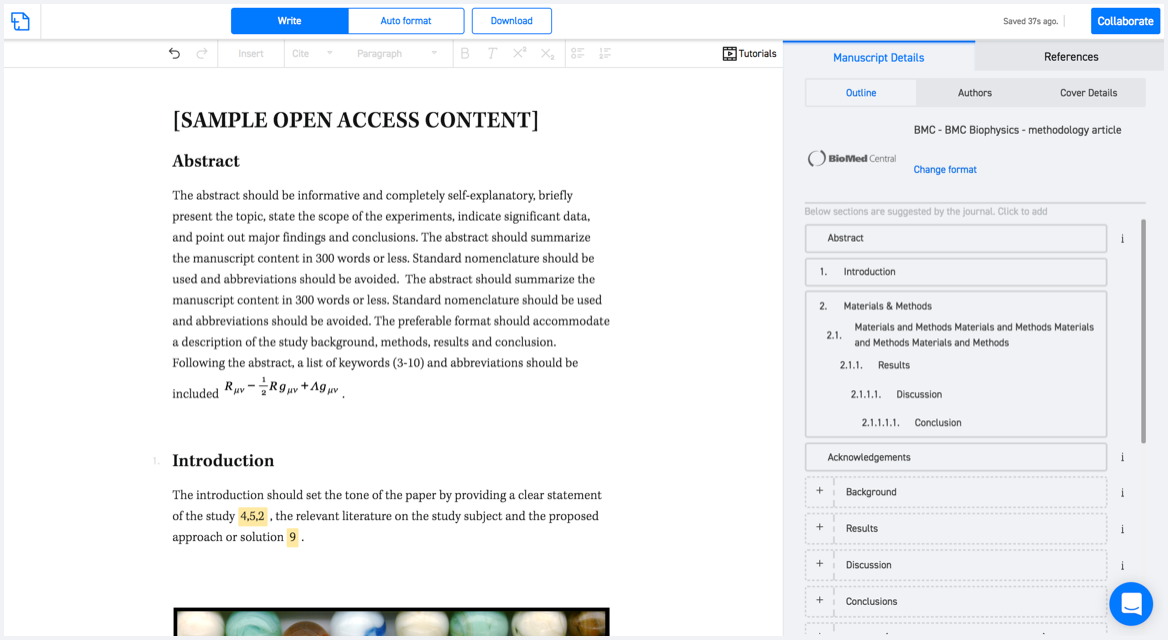
Typset automatically formats your research paper to Statistics in Medicine formatting guidelines and citation style.

Verifed journal formats

One editor, 100K journal formats.
With the largest collection of verified journal formats, what you need is already there.

Trusted by academicians

I spent hours with MS word for reformatting. It was frustrating - plain and simple. With SciSpace, I can draft my manuscripts and once it is finished I can just submit. In case, I have to submit to another journal it is really just a button click instead of an afternoon of reformatting.

Andreas Frutiger
Researcher & Ex MS Word user
Use this template