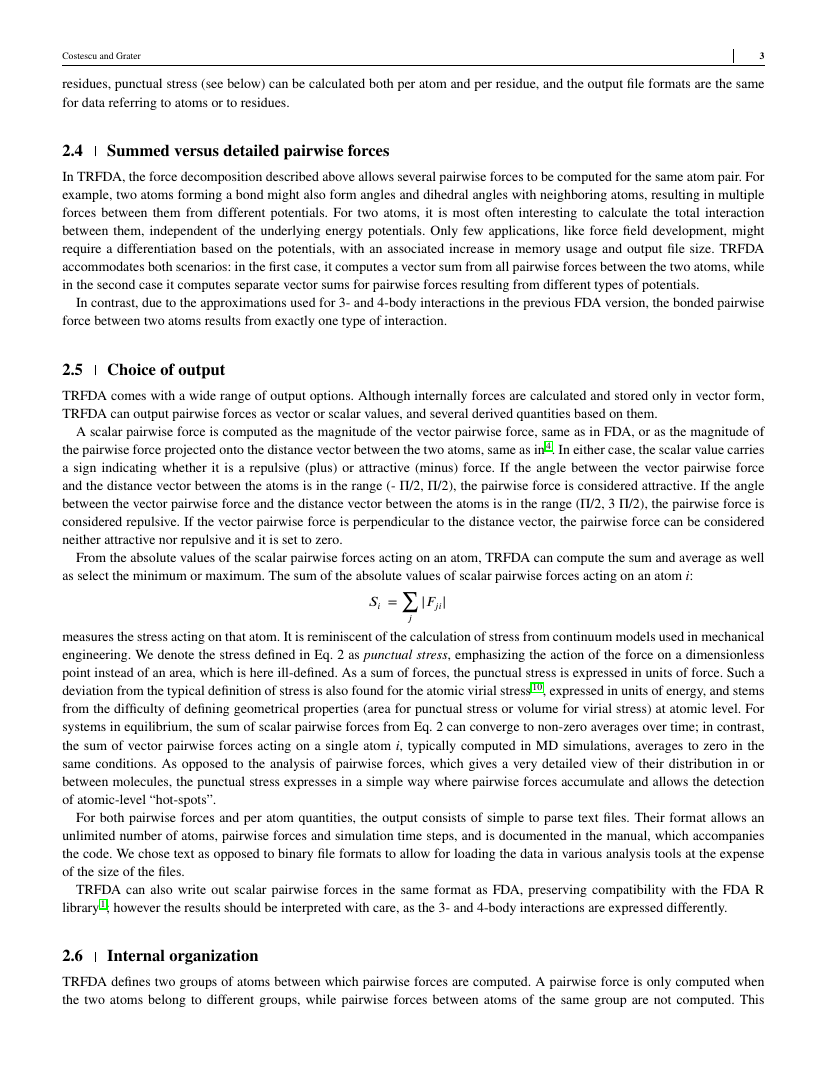
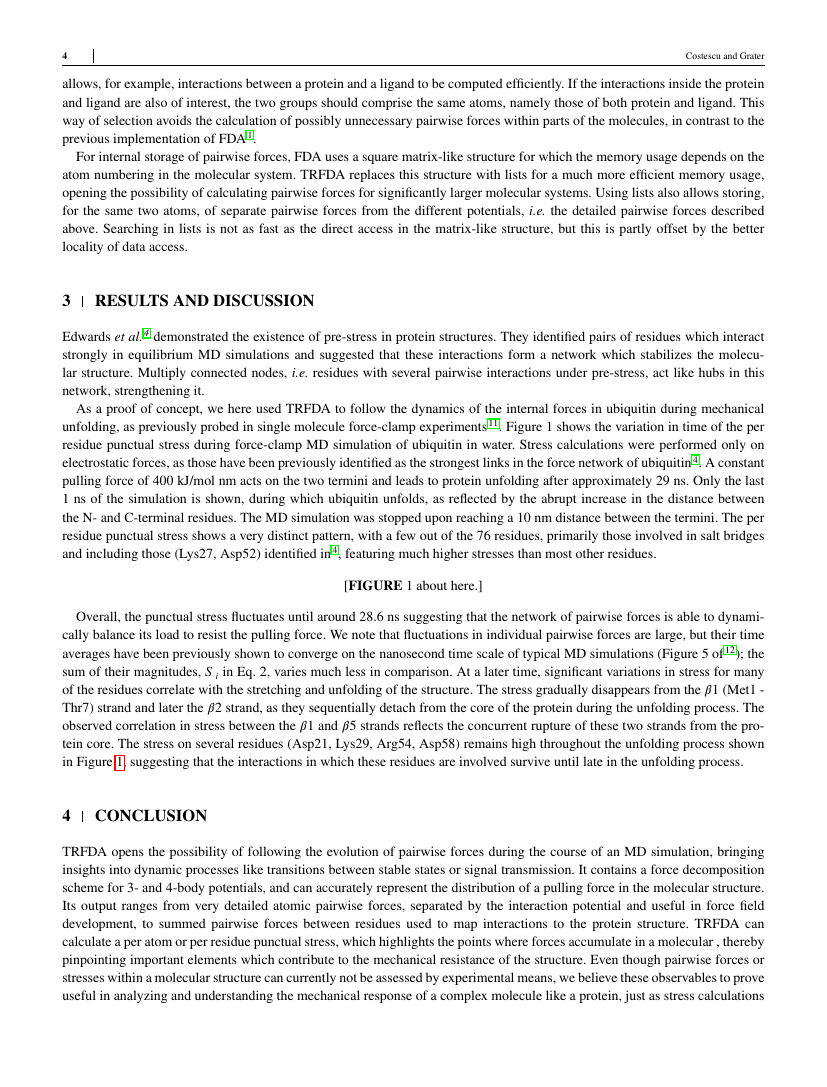
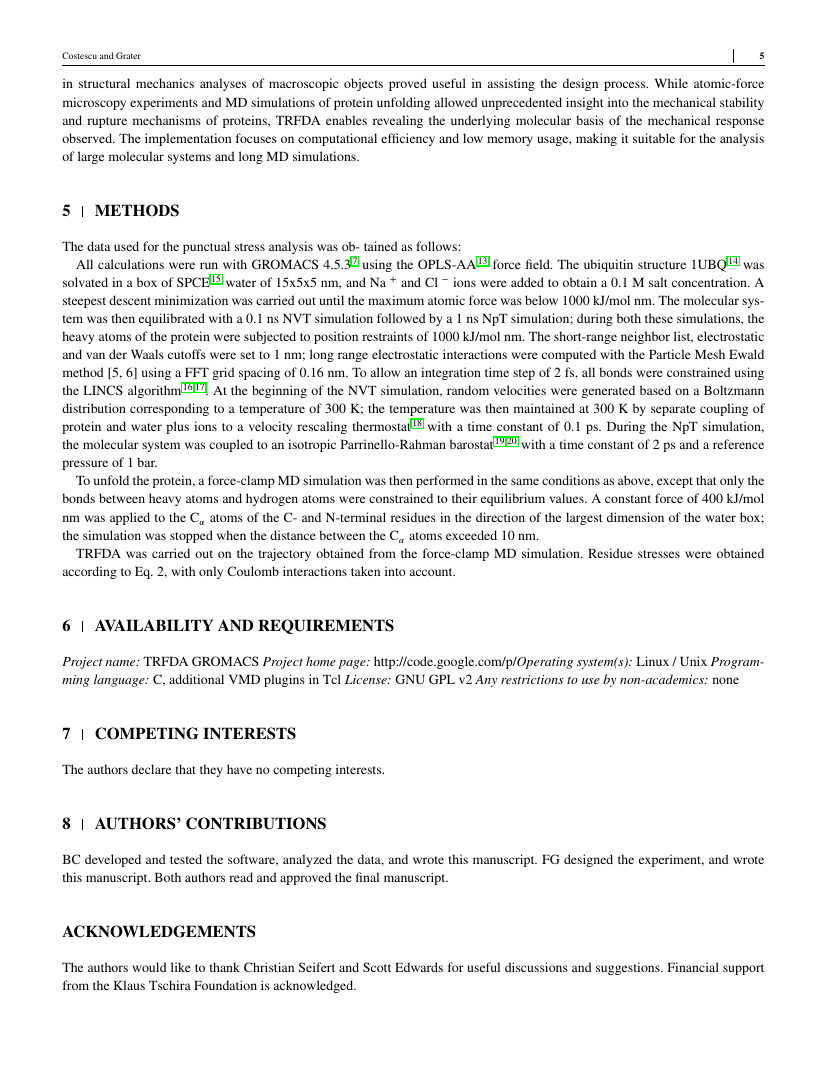
Example of Surface and Interface Analysis format
Recent searches

Example of Surface and Interface Analysis format Example of Surface and Interface Analysis format Example of Surface and Interface Analysis format Example of Surface and Interface Analysis format Example of Surface and Interface Analysis format Example of Surface and Interface Analysis format Example of Surface and Interface Analysis format Example of Surface and Interface Analysis format
Sample paper formatted on SciSpace - SciSpace
This content is only for preview purposes. The original open access content can be found here.
Look Inside
Example of Surface and Interface Analysis format Example of Surface and Interface Analysis format Example of Surface and Interface Analysis format Example of Surface and Interface Analysis format Example of Surface and Interface Analysis format Example of Surface and Interface Analysis format Example of Surface and Interface Analysis format Example of Surface and Interface Analysis format
Sample paper formatted on SciSpace - SciSpace
This content is only for preview purposes. The original open access content can be found here.
open access Open Access

Surface and Interface Analysis — Template for authors

Publisher: Wiley
Categories Rank Trend in last 3 yrs
Materials Chemistry #123 of 292 up up by 1 rank
Chemistry (all) #169 of 398 up up by 12 ranks
Surfaces, Coatings and Films #54 of 123 up up by 2 ranks
Condensed Matter Physics #199 of 411 up up by 8 ranks
Surfaces and Interfaces #31 of 54 down down by 4 ranks
journal-quality-icon Journal quality:
Good
calendar-icon Last 4 years overview: 683 Published Papers | 2068 Citations
indexed-in-icon Indexed in: Scopus
last-updated-icon Last updated: 05/06/2020
Related journals
Insights
General info
Top papers
Popular templates
Get started guide
Why choose from SciSpace
FAQ

Related Journals

open access Open Access
recommended Recommended

Elsevier

Quality:  
High
CiteRatio: 20.7
SJR: 3.627
SNIP: 4.351
open access Open Access

Elsevier

Quality:  
High
CiteRatio: 6.6
SJR: 0.904
SNIP: 1.38
open access Open Access
recommended Recommended

Elsevier

Quality:  
High
CiteRatio: 7.2
SJR: 1.205
SNIP: 1.972
open access Open Access
recommended Recommended

Elsevier

Quality:  
High
CiteRatio: 16.4
SJR: 2.643
SNIP: 2.814

Journal Performance & Insights

Impact Factor

CiteRatio

Determines the importance of a journal by taking a measure of frequency with which the average article in a journal has been cited in a particular year.

A measure of average citations received per peer-reviewed paper published in the journal.

1.665

26% from 2018

Impact factor for Surface and Interface Analysis from 2016 - 2019
Year Value
2019 1.665
2018 1.319
2017 1.263
2016 1.132
graph view Graph view
table view Table view

3.0

11% from 2019

CiteRatio for Surface and Interface Analysis from 2016 - 2020
Year Value
2020 3.0
2019 2.7
2018 2.4
2017 2.1
2016 2.4
graph view Graph view
table view Table view

insights Insights

  • Impact factor of this journal has increased by 26% in last year.
  • This journal’s impact factor is in the top 10 percentile category.

insights Insights

  • CiteRatio of this journal has increased by 11% in last years.
  • This journal’s CiteRatio is in the top 10 percentile category.

SCImago Journal Rank (SJR)

Source Normalized Impact per Paper (SNIP)

Measures weighted citations received by the journal. Citation weighting depends on the categories and prestige of the citing journal.

Measures actual citations received relative to citations expected for the journal's category.

0.52

15% from 2019

SJR for Surface and Interface Analysis from 2016 - 2020
Year Value
2020 0.52
2019 0.453
2018 0.451
2017 0.392
2016 0.434
graph view Graph view
table view Table view

0.817

15% from 2019

SNIP for Surface and Interface Analysis from 2016 - 2020
Year Value
2020 0.817
2019 0.713
2018 0.648
2017 0.524
2016 0.657
graph view Graph view
table view Table view

insights Insights

  • SJR of this journal has increased by 15% in last years.
  • This journal’s SJR is in the top 10 percentile category.

insights Insights

  • SNIP of this journal has increased by 15% in last years.
  • This journal’s SNIP is in the top 10 percentile category.

Surface and Interface Analysis

Guideline source: View

All company, product and service names used in this website are for identification purposes only. All product names, trademarks and registered trademarks are property of their respective owners.

Use of these names, trademarks and brands does not imply endorsement or affiliation. Disclaimer Notice

Wiley

Surface and Interface Analysis

Surface and Interface Analysis is devoted to the publication of papers dealing with the development and application of techniques for the characterization of surfaces, interfaces and thin films. Papers dealing with standardization and quantification are particularly welcome, a...... Read More

Surfaces, Coatings and Films

Materials Chemistry

General Chemistry

Condensed Matter Physics

Surfaces and Interfaces

Materials Science

i
Last updated on
04 Jun 2020
i
ISSN
1096-9918
i
Impact Factor
High - 1.132
i
Acceptance Rate
Not provided
i
Frequency
8 issues per year
i
Open Access
Yes
i
Sherpa RoMEO Archiving Policy
Yellow faq
i
Plagiarism Check
Available via Turnitin
i
Endnote Style
Download Available
i
Bibliography Name
apa
i
Citation Type
Numbered
[25]
i
Bibliography Example
Beenakker, C.W.J. (2006) Specular andreev reflection in graphene.Phys. Rev. Lett., 97 (6), 067 007. URL 10.1103/PhysRevLett.97.067007.

Top papers written in this journal

Journal Article DOI: 10.1002/SIA.740010103
Quantitative electron spectroscopy of surfaces: A standard data base for electron inelastic mean free paths in solids
Martin P. Seah1, W. A. Dench1

Abstract:

A compilation is presented of all published measurements of electron inelastic mean free path lengths in solids for energies in the range 0–10 000 eV above the Fermi level. For analysis, the materials are grouped under one of the headings: element, inorganic compound, organic compound and adsorbed gas, with the path lengths e... A compilation is presented of all published measurements of electron inelastic mean free path lengths in solids for energies in the range 0–10 000 eV above the Fermi level. For analysis, the materials are grouped under one of the headings: element, inorganic compound, organic compound and adsorbed gas, with the path lengths each time expressed in nanometers, monolayers and milligrams per square metre. The path lengths are vary high at low energies, fall to 0.1–0.8 nm for energies in the range 30–100 eV and then rise again as the energy increases further. For elements and inorganic compounds the scatter about a ‘universal curve’ is least when the path lengths are expressed in monolayers, λm. Analysis of the inter-element and inter-compound effects shows that λm is related to atom size and the most accuratae relations are λm = 538E−2+0.41(aE)1/2 for elements and λm=2170E−2+0.72(aE)1/2 for inorganic compounds, where a is the monolayer thickness (nm) and E is the electron energy above the Fermi level in eV. For organic compounds λd=49E−2+0.11E1/2 mgm−2. Published general theoretical predictions for λ, valid above 150 eV, do not show as good correlations with the experimental data as the above relations. read more read less

Topics:

Inelastic mean free path (61%)61% related to the paper, Inorganic compound (56%)56% related to the paper, Electron spectroscopy (52%)52% related to the paper, Fermi level (52%)52% related to the paper
4,486 Citations
open accessOpen access Journal Article DOI: 10.1002/SIA.1984
Investigation of multiplet splitting of Fe 2p XPS spectra and bonding in iron compounds
Andrew P. Grosvenor1, B. A. Kobe1, Mark C. Biesinger1, N. S. McIntyre1

Abstract:

Ferrous (Fe2+) and ferric (Fe3+) compounds were investigated by XPS to determine the usefulness of calculated multiplet peaks to fit high-resolution iron 2p3/2 spectra from high-spin compounds. The multiplets were found to fit most spectra well, particularly when contributions attributed to surface peaks and shake-up satellit... Ferrous (Fe2+) and ferric (Fe3+) compounds were investigated by XPS to determine the usefulness of calculated multiplet peaks to fit high-resolution iron 2p3/2 spectra from high-spin compounds. The multiplets were found to fit most spectra well, particularly when contributions attributed to surface peaks and shake-up satellites were included. This information was useful for fitting of the complex Fe 2p3/2 spectra for Fe3O4 where both Fe2+ and Fe3+ species are present. It was found that as the ionic bond character of the iron —ligand bond increased, the binding energy associated with either the ferrous or ferric 2p3/2 photoelectron peak also increased. This was determined to be due to the decrease in shielding of the iron cation by the more increasingly electronegative ligands. It was also observed that the difference in energy between a high-spin iron 2p3/2 peak and its corresponding shake-up satellite peak increased as the electronegativity of the ligand increased. The extrinsic loss spectra for ion oxides are also reported; these are as characteristic of each species as are the photoelectron peaks. Copyright © 2004 John Wiley & Sons, Ltd. read more read less

Topics:

Ferric (61%)61% related to the paper, Ferrous (56%)56% related to the paper, Ionic bonding (52%)52% related to the paper, X-ray photoelectron spectroscopy (52%)52% related to the paper, Electronegativity (51%)51% related to the paper
View PDF
2,637 Citations
Journal Article DOI: 10.1002/SIA.740210302
Calculations of electron inelastic mean free paths. III. Data for 15 inorganic compounds over the 50–2000 eV range
Shigeo Tanuma, Cedric J. Powell1, David R. Penn1

Abstract:

We report calculations of electron inelastic mean free paths (IMFPs) of 50–2000 eV electrons for a group of 14 organic compounds: 26-n-paraffin, adenine, β-carotene, bovine plasma albumin, deoxyribonucleic acid, diphenylhexatriene, guanine, kapton, polyacetylene, poly(butene-1-sulfone), polyethylene, polymethylmethacrylate, p... We report calculations of electron inelastic mean free paths (IMFPs) of 50–2000 eV electrons for a group of 14 organic compounds: 26-n-paraffin, adenine, β-carotene, bovine plasma albumin, deoxyribonucleic acid, diphenylhexatriene, guanine, kapton, polyacetylene, poly(butene-1-sulfone), polyethylene, polymethylmethacrylate, polystyrene and poly(2-vinylpyridine). The computed IMFPs for these compounds showed greater similarities in magnitude and in the dependences on electron energy than was found in our previous calculations for groups of elements and inorganic compounds (Papers II and III in this series). Comparison of the IMFPs for the organic compounds with values obtained from our predictive IMFP formula TPP-2 showed systematic differences of ∼40%. These differences are due to the extrapolation of TPP-2 from the regime of mainly high-density elements (from which it had been developed and tested) to the low-density materials such as the organic compounds. We analyzed the IMFP data for the groups of elements and organic compounds together and derived a modified empirical expression for one of the parameters in our predictive IMFP equation. The modified equation, denoted TPP-2M, is believed to be satisfactory for estimating IMFPs in elements, inorganic compounds and organic compounds. read more read less

Topics:

Inorganic compound (57%)57% related to the paper, Inelastic mean free path (53%)53% related to the paper
2,383 Citations
Journal Article DOI: 10.1002/SIA.740030506
Empirical atomic sensitivity factors for quantitative analysis by electron spectroscopy for chemical analysis
C. D. Wagner, L. E. Davis1, M. V. Zeller1, J. A. Taylor1, R. H. Raymond2, L. H. Gale2

Abstract:

Quantitative information from electron spectroscopy for chemical analysis requires the use of suitable atomic sensitivity factors. An empirical set has been developed, based upon data from 135 compounds of 62 elements. Data upon which the factors are based are intensity ratios of spectral lines with F1s as a primary standard,... Quantitative information from electron spectroscopy for chemical analysis requires the use of suitable atomic sensitivity factors. An empirical set has been developed, based upon data from 135 compounds of 62 elements. Data upon which the factors are based are intensity ratios of spectral lines with F1s as a primary standard, value unity, and K2p3/2 as a secondary standard. The data were obtained on two instruments, the Physical Electronics 550 and the Varian IEE-15, two instruments that use electron retardation for scanning, with constant pass energy. The agreement in data from the two instruments on the same compounds is good. How closely the data can apply to instruments with input lens systems is not known. Calculated cross-section data plotted against binding energy on a log-log plot provide curves composed of simple linear segments for the strong lines: 1s, 2p3/2, 3d5/2 and 4f7/2. Similarly, the plots for the secondary lines, 2s, 3p3/2, 4d5/2 and 5d5/2, are shown to be composed of linear segments. Theoretical sensitivity factors relative to F1s should fall on similar curves, with minor correction for the combined energy dependence of instrumental transmission and mean free path. Experimental intensity ratios relative to F1s were plotted similarly, and best fit curves were calculated using the shapes of the theoretical curves as a guide. The intercepts of these best fit curves with appropriate binding energies provide sensitivity factors for the strong lines and the secondary lines for all of the elements except the rare earths and the first series of transition metals. For these elements the sensitivity factors are lower than expected, and variable, because of multi-electron processes that vary with chemical state. From the data it can be shown that many of the commonly-accepted calculated cross-section data must be significantly in error—as much as 40% in some cases for the strong lines, and far more than that for some of the secondary lines. read more read less
1,817 Citations
open accessOpen access Journal Article DOI: 10.1002/SIA.3026
X-ray photoelectron spectroscopic chemical state quantification of mixed nickel metal, oxide and hydroxide systems
Mark C. Biesinger1, Mark C. Biesinger2, B.P. Payne2, Leo W. M. Lau2, Andrea R. Gerson1, Roger St. C. Smart1

Abstract:

Quantitative chemical state X-ray photoelectron spectroscopic analysis of mixed nickel metal, oxide, hydroxide and oxyhydroxide systems is challenging due to the complexity of the Ni 2p peak shapes resulting from multiplet splitting, shake-up and plasmon loss structures. Quantification of mixed nickel chemical states and the ... Quantitative chemical state X-ray photoelectron spectroscopic analysis of mixed nickel metal, oxide, hydroxide and oxyhydroxide systems is challenging due to the complexity of the Ni 2p peak shapes resulting from multiplet splitting, shake-up and plasmon loss structures. Quantification of mixed nickel chemical states and the qualitative determination of low concentrations of Ni(III) species are demonstrated via an approach based on standard spectra from quality reference samples (Ni, NiO, Ni(OH)2, NiOOH), subtraction of these spectra, and data analysis that integrates information from the Ni 2p spectrum and the O 1s spectra. Quantification of a commercial nickel powder and a thin nickel oxide film grown at 1-Torr O2 and 300 °C for 20 min is demonstrated. The effect of uncertain relative sensitivity factors (e.g. Ni 2.67 ± 0.54) is discussed, as is the depth of measurement for thin film analysis based on calculated inelastic mean free paths. Copyright © 2009 John Wiley & Sons, Ltd. read more read less

Topics:

Nickel oxide (63%)63% related to the paper, Nickel (58%)58% related to the paper, Oxide (54%)54% related to the paper, Chemical state (54%)54% related to the paper, Hydroxide (51%)51% related to the paper
View PDF
1,215 Citations
Author Pic

SciSpace is a very innovative solution to the formatting problem and existing providers, such as Mendeley or Word did not really evolve in recent years.

- Andreas Frutiger, Researcher, ETH Zurich, Institute for Biomedical Engineering

Get MS-Word and LaTeX output to any Journal within seconds
1
Choose a template
Select a template from a library of 40,000+ templates
2
Import a MS-Word file or start fresh
It takes only few seconds to import
3
View and edit your final output
SciSpace will automatically format your output to meet journal guidelines
4
Submit directly or Download
Submit to journal directly or Download in PDF, MS Word or LaTeX

(Before submission check for plagiarism via Turnitin)

clock Less than 3 minutes

What to expect from SciSpace?

Speed and accuracy over MS Word

''

With SciSpace, you do not need a word template for Surface and Interface Analysis.

It automatically formats your research paper to Wiley formatting guidelines and citation style.

You can download a submission ready research paper in pdf, LaTeX and docx formats.

Time comparison

Time taken to format a paper and Compliance with guidelines

Plagiarism Reports via Turnitin

SciSpace has partnered with Turnitin, the leading provider of Plagiarism Check software.

Using this service, researchers can compare submissions against more than 170 million scholarly articles, a database of 70+ billion current and archived web pages. How Turnitin Integration works?

Turnitin Stats
Publisher Logos

Freedom from formatting guidelines

One editor, 100K journal formats – world's largest collection of journal templates

With such a huge verified library, what you need is already there.

publisher-logos

Easy support from all your favorite tools

Surface and Interface Analysis format uses apa citation style.

Automatically format and order your citations and bibliography in a click.

SciSpace allows imports from all reference managers like Mendeley, Zotero, Endnote, Google Scholar etc.

Frequently asked questions

1. Can I write Surface and Interface Analysis in LaTeX?

Absolutely not! Our tool has been designed to help you focus on writing. You can write your entire paper as per the Surface and Interface Analysis guidelines and auto format it.

2. Do you follow the Surface and Interface Analysis guidelines?

Yes, the template is compliant with the Surface and Interface Analysis guidelines. Our experts at SciSpace ensure that. If there are any changes to the journal's guidelines, we'll change our algorithm accordingly.

3. Can I cite my article in multiple styles in Surface and Interface Analysis?

Of course! We support all the top citation styles, such as APA style, MLA style, Vancouver style, Harvard style, and Chicago style. For example, when you write your paper and hit autoformat, our system will automatically update your article as per the Surface and Interface Analysis citation style.

4. Can I use the Surface and Interface Analysis templates for free?

Sign up for our free trial, and you'll be able to use all our features for seven days. You'll see how helpful they are and how inexpensive they are compared to other options, Especially for Surface and Interface Analysis.

5. Can I use a manuscript in Surface and Interface Analysis that I have written in MS Word?

Yes. You can choose the right template, copy-paste the contents from the word document, and click on auto-format. Once you're done, you'll have a publish-ready paper Surface and Interface Analysis that you can download at the end.

6. How long does it usually take you to format my papers in Surface and Interface Analysis?

It only takes a matter of seconds to edit your manuscript. Besides that, our intuitive editor saves you from writing and formatting it in Surface and Interface Analysis.

7. Where can I find the template for the Surface and Interface Analysis?

It is possible to find the Word template for any journal on Google. However, why use a template when you can write your entire manuscript on SciSpace , auto format it as per Surface and Interface Analysis's guidelines and download the same in Word, PDF and LaTeX formats? Give us a try!.

8. Can I reformat my paper to fit the Surface and Interface Analysis's guidelines?

Of course! You can do this using our intuitive editor. It's very easy. If you need help, our support team is always ready to assist you.

9. Surface and Interface Analysis an online tool or is there a desktop version?

SciSpace's Surface and Interface Analysis is currently available as an online tool. We're developing a desktop version, too. You can request (or upvote) any features that you think would be helpful for you and other researchers in the "feature request" section of your account once you've signed up with us.

10. I cannot find my template in your gallery. Can you create it for me like Surface and Interface Analysis?

Sure. You can request any template and we'll have it setup within a few days. You can find the request box in Journal Gallery on the right side bar under the heading, "Couldn't find the format you were looking for like Surface and Interface Analysis?”

11. What is the output that I would get after using Surface and Interface Analysis?

After writing your paper autoformatting in Surface and Interface Analysis, you can download it in multiple formats, viz., PDF, Docx, and LaTeX.

12. Is Surface and Interface Analysis's impact factor high enough that I should try publishing my article there?

To be honest, the answer is no. The impact factor is one of the many elements that determine the quality of a journal. Few of these factors include review board, rejection rates, frequency of inclusion in indexes, and Eigenfactor. You need to assess all these factors before you make your final call.

13. What is Sherpa RoMEO Archiving Policy for Surface and Interface Analysis?

SHERPA/RoMEO Database

We extracted this data from Sherpa Romeo to help researchers understand the access level of this journal in accordance with the Sherpa Romeo Archiving Policy for Surface and Interface Analysis. The table below indicates the level of access a journal has as per Sherpa Romeo's archiving policy.

RoMEO Colour Archiving policy
Green Can archive pre-print and post-print or publisher's version/PDF
Blue Can archive post-print (ie final draft post-refereeing) or publisher's version/PDF
Yellow Can archive pre-print (ie pre-refereeing)
White Archiving not formally supported
FYI:
  1. Pre-prints as being the version of the paper before peer review and
  2. Post-prints as being the version of the paper after peer-review, with revisions having been made.

14. What are the most common citation types In Surface and Interface Analysis?

The 5 most common citation types in order of usage for Surface and Interface Analysis are:.

S. No. Citation Style Type
1. Author Year
2. Numbered
3. Numbered (Superscripted)
4. Author Year (Cited Pages)
5. Footnote

15. How do I submit my article to the Surface and Interface Analysis?

It is possible to find the Word template for any journal on Google. However, why use a template when you can write your entire manuscript on SciSpace , auto format it as per Surface and Interface Analysis's guidelines and download the same in Word, PDF and LaTeX formats? Give us a try!.

16. Can I download Surface and Interface Analysis in Endnote format?

Yes, SciSpace provides this functionality. After signing up, you would need to import your existing references from Word or Bib file to SciSpace. Then SciSpace would allow you to download your references in Surface and Interface Analysis Endnote style according to Elsevier guidelines.

Fast and reliable,
built for complaince.

Instant formatting to 100% publisher guidelines on - SciSpace.
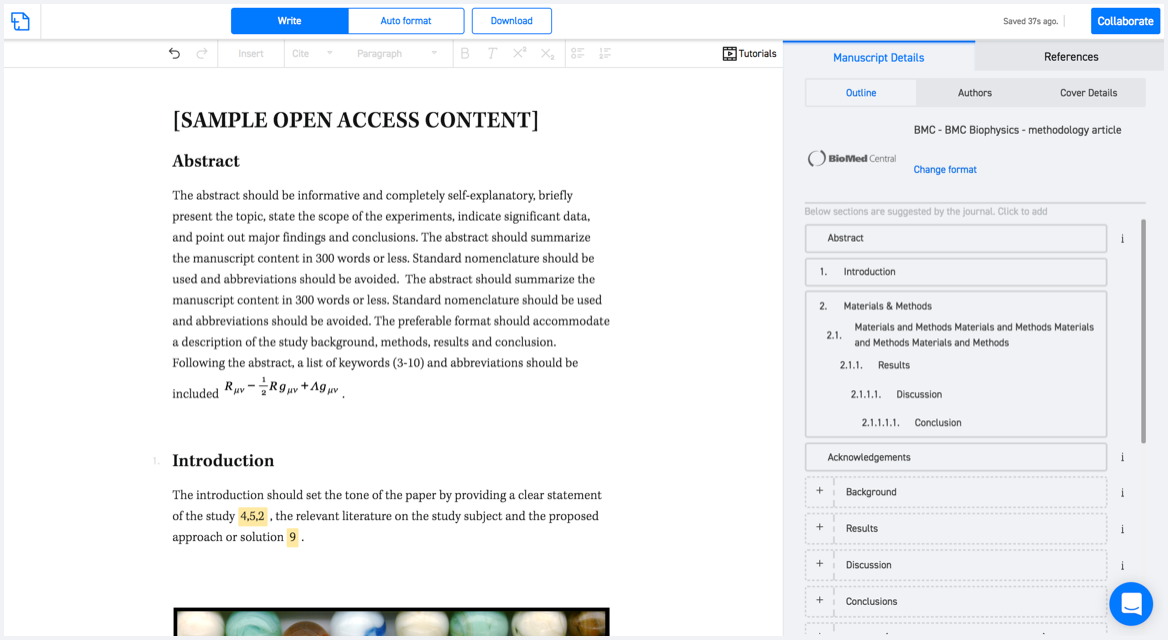
Available only on desktops 🖥

No word template required

Typset automatically formats your research paper to Surface and Interface Analysis formatting guidelines and citation style.
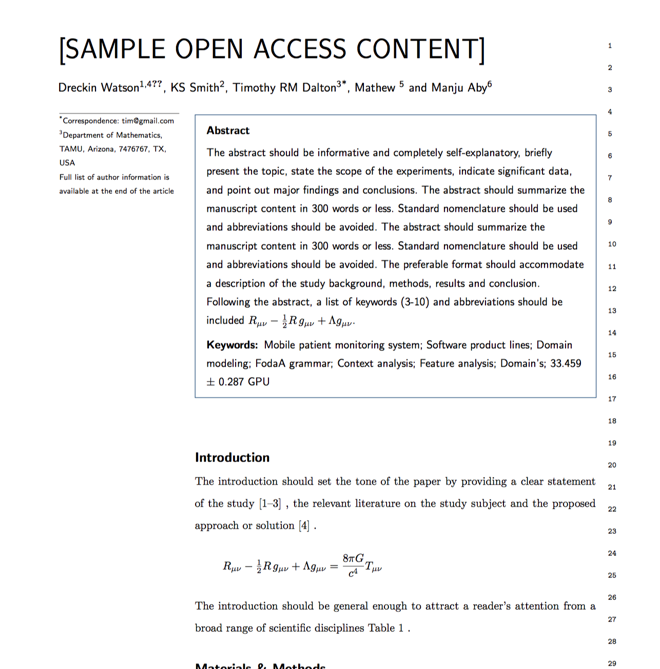
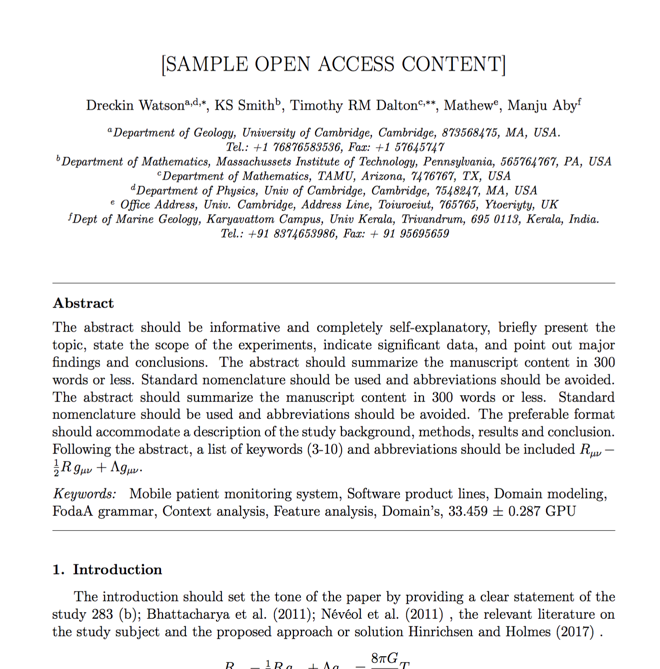
Verifed journal formats

One editor, 100K journal formats.
With the largest collection of verified journal formats, what you need is already there.

Trusted by academicians

I spent hours with MS word for reformatting. It was frustrating - plain and simple. With SciSpace, I can draft my manuscripts and once it is finished I can just submit. In case, I have to submit to another journal it is really just a button click instead of an afternoon of reformatting.

Andreas Frutiger
Researcher & Ex MS Word user
Use this template